
Project timelines change when dates move, approvals take longer, or priorities shift. This project Gantt chart template is designed for managing that change inside a spreadsheet. You enter task details once, adjust dates as needed, and the chart reflects those updates so the schedule stays readable during planning, handoffs, and progress reviews.
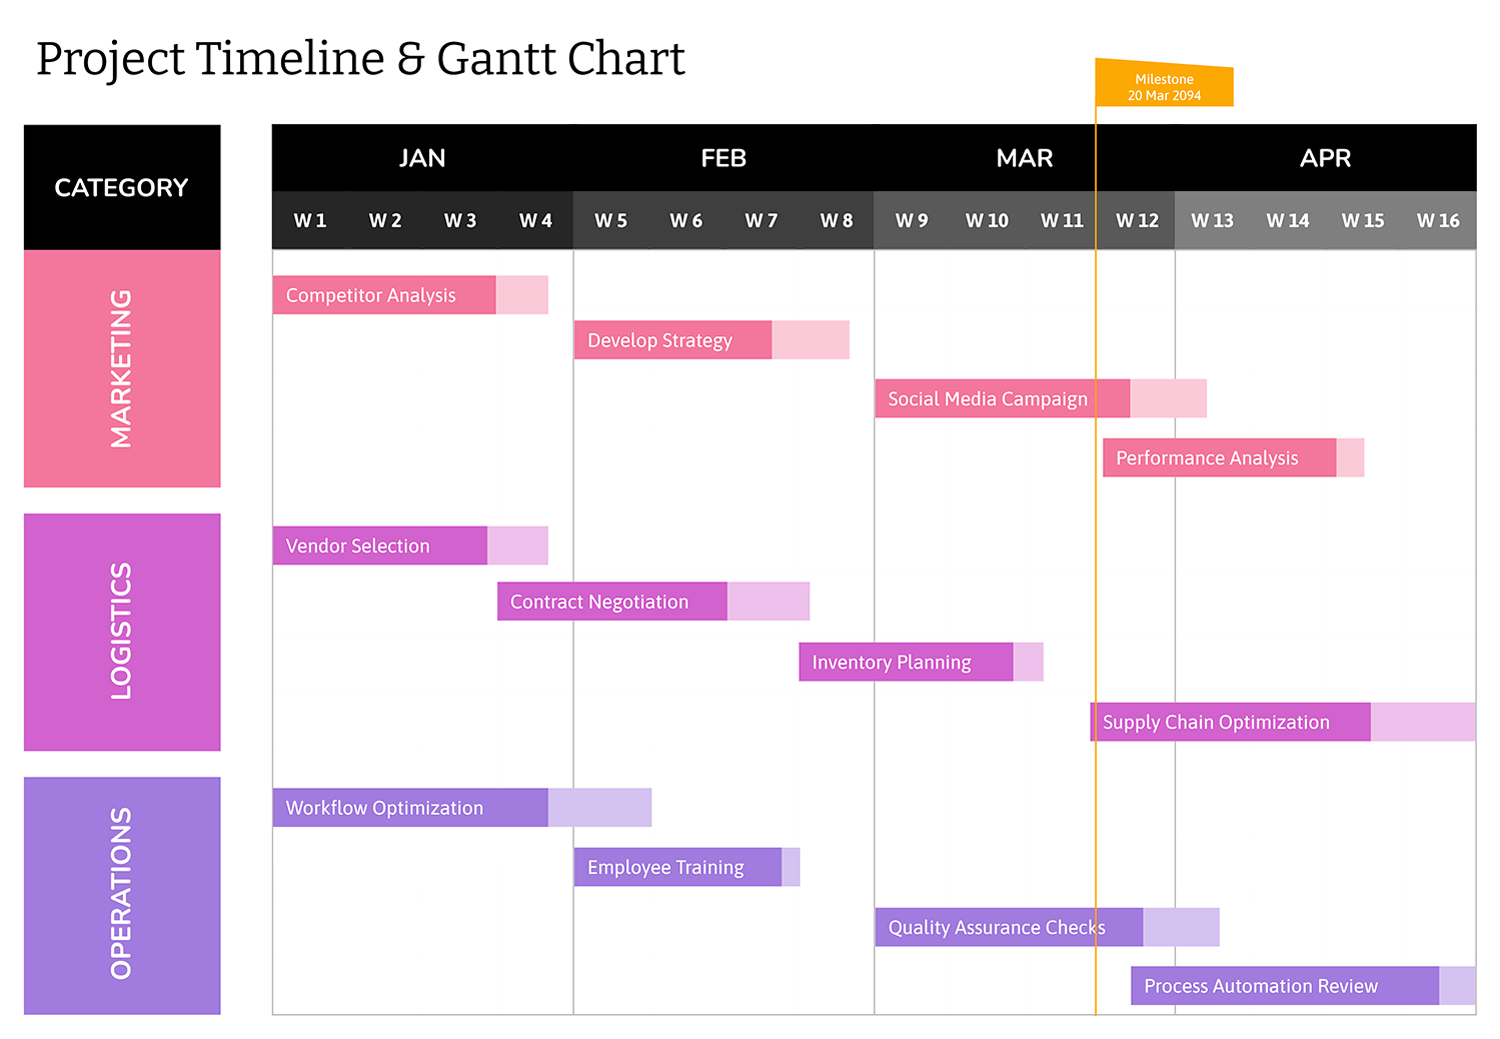
Using this template, you can group work into phases, assign task owners, track progress with a percentage bar, and mark major checkpoints as milestones. The Gantt area translates your start and end dates into timeline bars, so overlaps and gaps are easier to notice when you review the plan.
Set Up the Project Header and Timeline Range
Fill in the top header fields so the file is identifiable when shared or exported. The project title, company name, and project manager fields are straightforward text entries.
The timeline range is controlled by the first date cell in the timeline row above the chart. When you change that first date, the rest of the dates follow forward day by day, which shifts the visible window of the Gantt chart.
If a task falls outside the visible date range, the task can still be listed in the table, but the bar may not appear fully until the timeline covers that period.
Enter Phases and Tasks
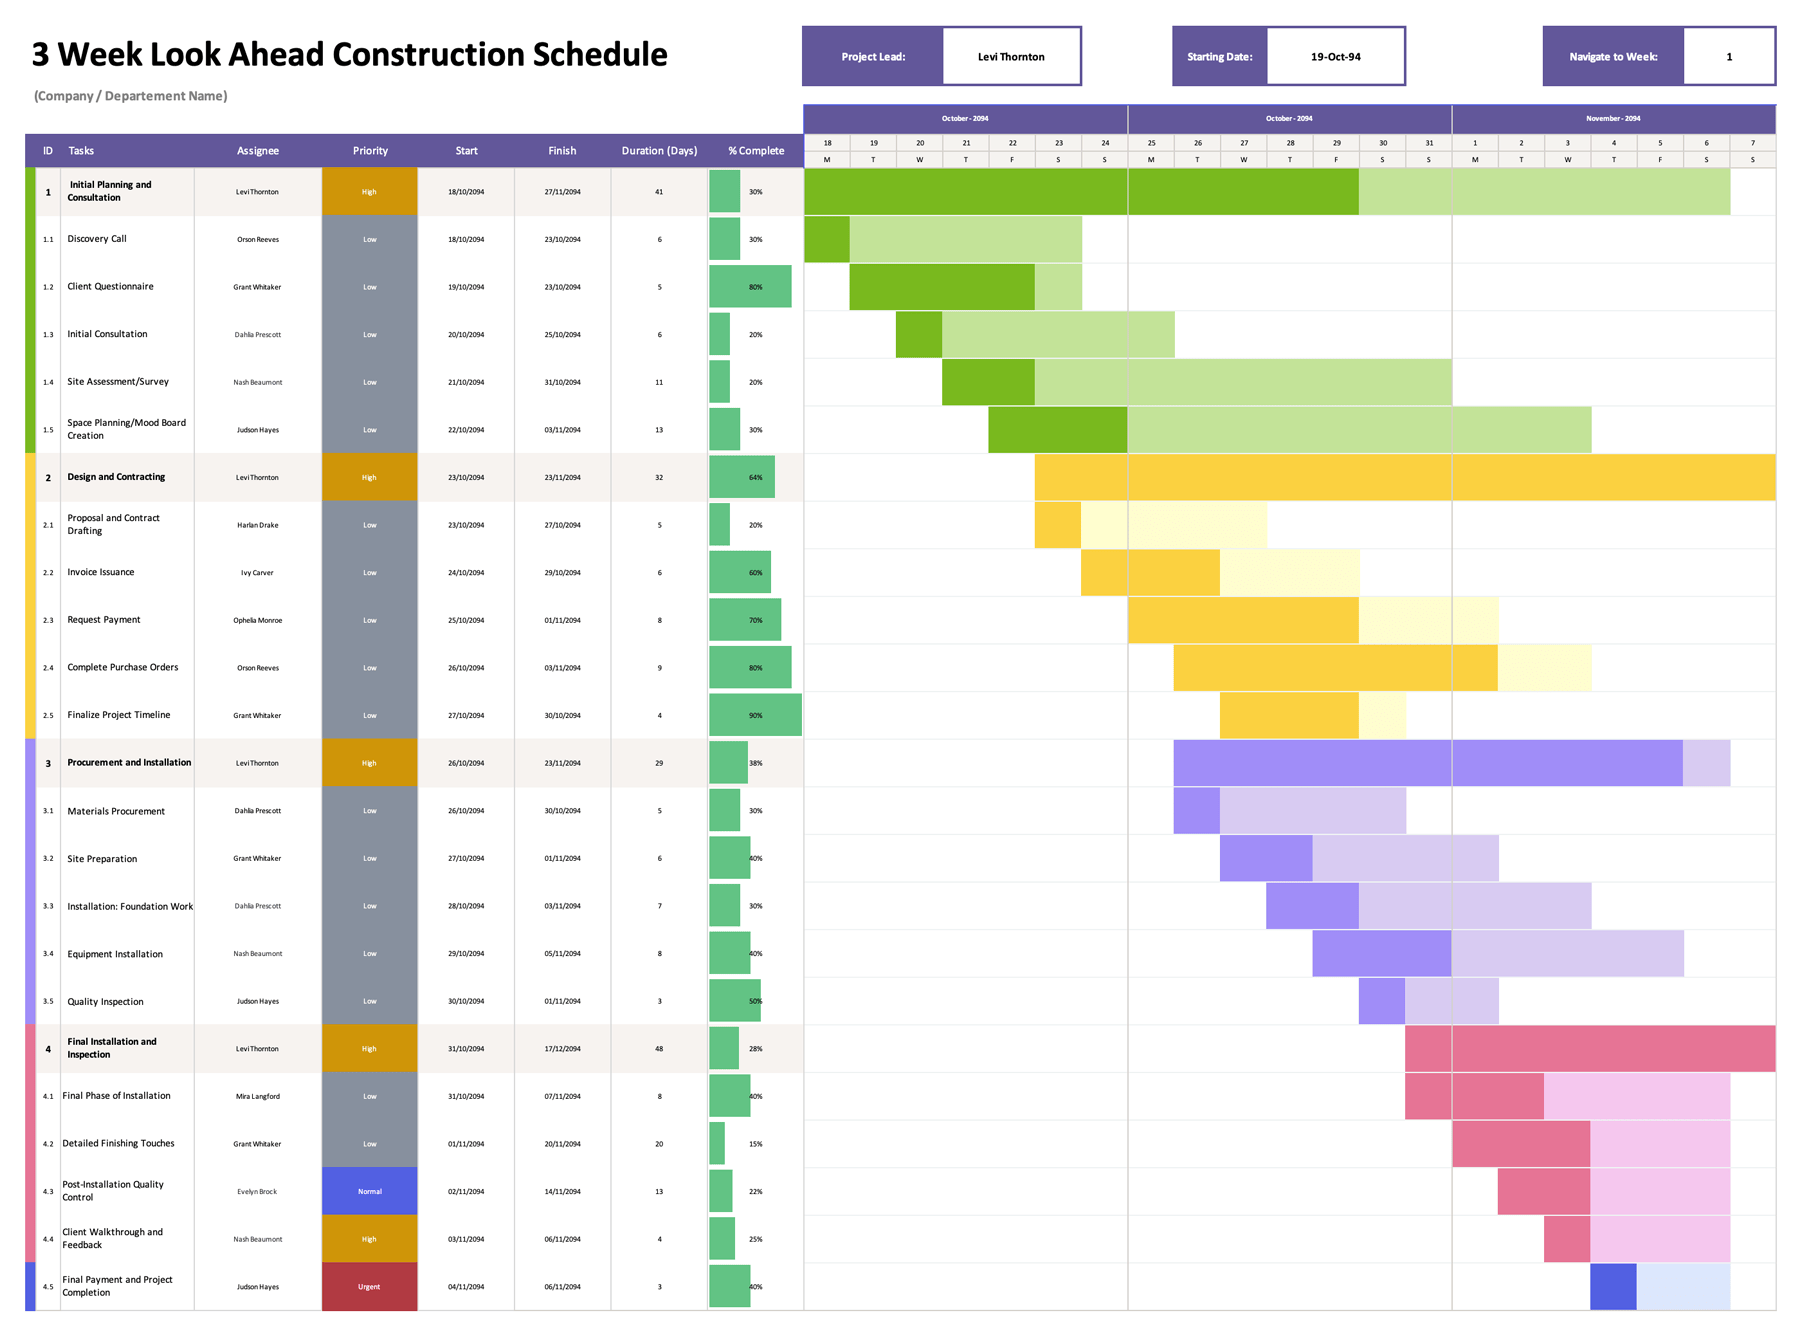
The sheet is arranged in phase blocks. Each block begins with a phase title row, followed by task rows for that phase. Rename each phase title to match how your project is organized, then enter tasks underneath.
Each task row is designed to carry the planning and reporting details that feed the chart. Task ID keeps tasks easy to reference during meetings. Task name is the short label you want to read quickly in the table. Task owner records responsibility for delivery or coordination. Start date and end date control where the task displays on the timeline.
Duration is calculated from the start and end dates using a weekday count, so weekends are not included. Progress is entered as a percentage and displayed with a progress data bar in the same cell, which makes updates easier to scan across a long task list.
How the Gantt Bars Update
The Gantt area responds to the task dates.
A bar begins on the start date, continues through the end date, and changes immediately when you change either date. If you move the start date later, the bar shifts later. If you shorten the end date, the bar shortens. Each phase block uses its own bar color so phases remain visually separated on the timeline.
Status and Milestones
Status is selected from a dropdown list and is tied to color rules in the status column. This makes it practical for reporting, since the status label and its visual cue move together.
Use these status options as the main reporting set.
- Completed for finished work
- In Progress for active work
- On Hold for paused work tied to a dependency or decision
- Delayed for work that is slipping beyond plan
- Milestone for checkpoint dates such as approvals, sign offs, handoffs, or launch dates
When you select Milestone, the chart marks the checkpoint on the start date so it stands apart from multi day task bars.
For a one day checkpoint, set the start date and end date to the same day, then select Milestone.
Expanding the Plan Without Breaking the Sheet Logic
If you need more task rows, copy an existing task row within the same phase block and paste it into the next blank row. This preserves the dropdown behavior, progress formatting, and the formulas that feed the chart.
If you need another phase, copy a phase title row plus a set of task rows and paste it below the last phase. Rename the phase title and continue your task IDs in the same pattern you already use.
If you rename status labels or add a new status, update the dropdown source list and then adjust the conditional formatting rules for the status column so the colors still match the labels. If the new label should behave like a milestone, update the milestone rule so the marker triggers on that label.
Wrap Up
This project Gantt chart template is available in Excel and Google Sheets, so you can use it in the format that fits your workflow. If you prefer working offline, you can maintain the file in Excel and keep updates in one saved workbook. If your team collaborates and needs shared editing, you can use the Google Sheets version so owners can update dates, progress, and status without sending new file copies back and forth.
Because the chart is driven by the task table, you do not need to rebuild the timeline when the plan changes. You can update start and end dates, adjust progress, or mark a checkpoint as a milestone, and the Gantt view stays aligned with the latest entries. This makes the template useful for ongoing project tracking, weekly reporting, and handoffs where the schedule needs to remain easy to scan.