
Income-driven repayment is a method used to estimate a federal student loan payment based on income, household size, and a poverty guideline amount that varies by location. This income based student loan repayment calculator applies those factors by using your selected plan, state group, household size, and income or AGI to estimate a monthly payment. It then calculates discretionary income, applies the plan’s payment percentage, and shows a simplified income-driven projection alongside a standard amortization schedule so you can compare payments, total amounts paid, and remaining balance over time.
Student Loan Calculator for Income Based Repayment
Export
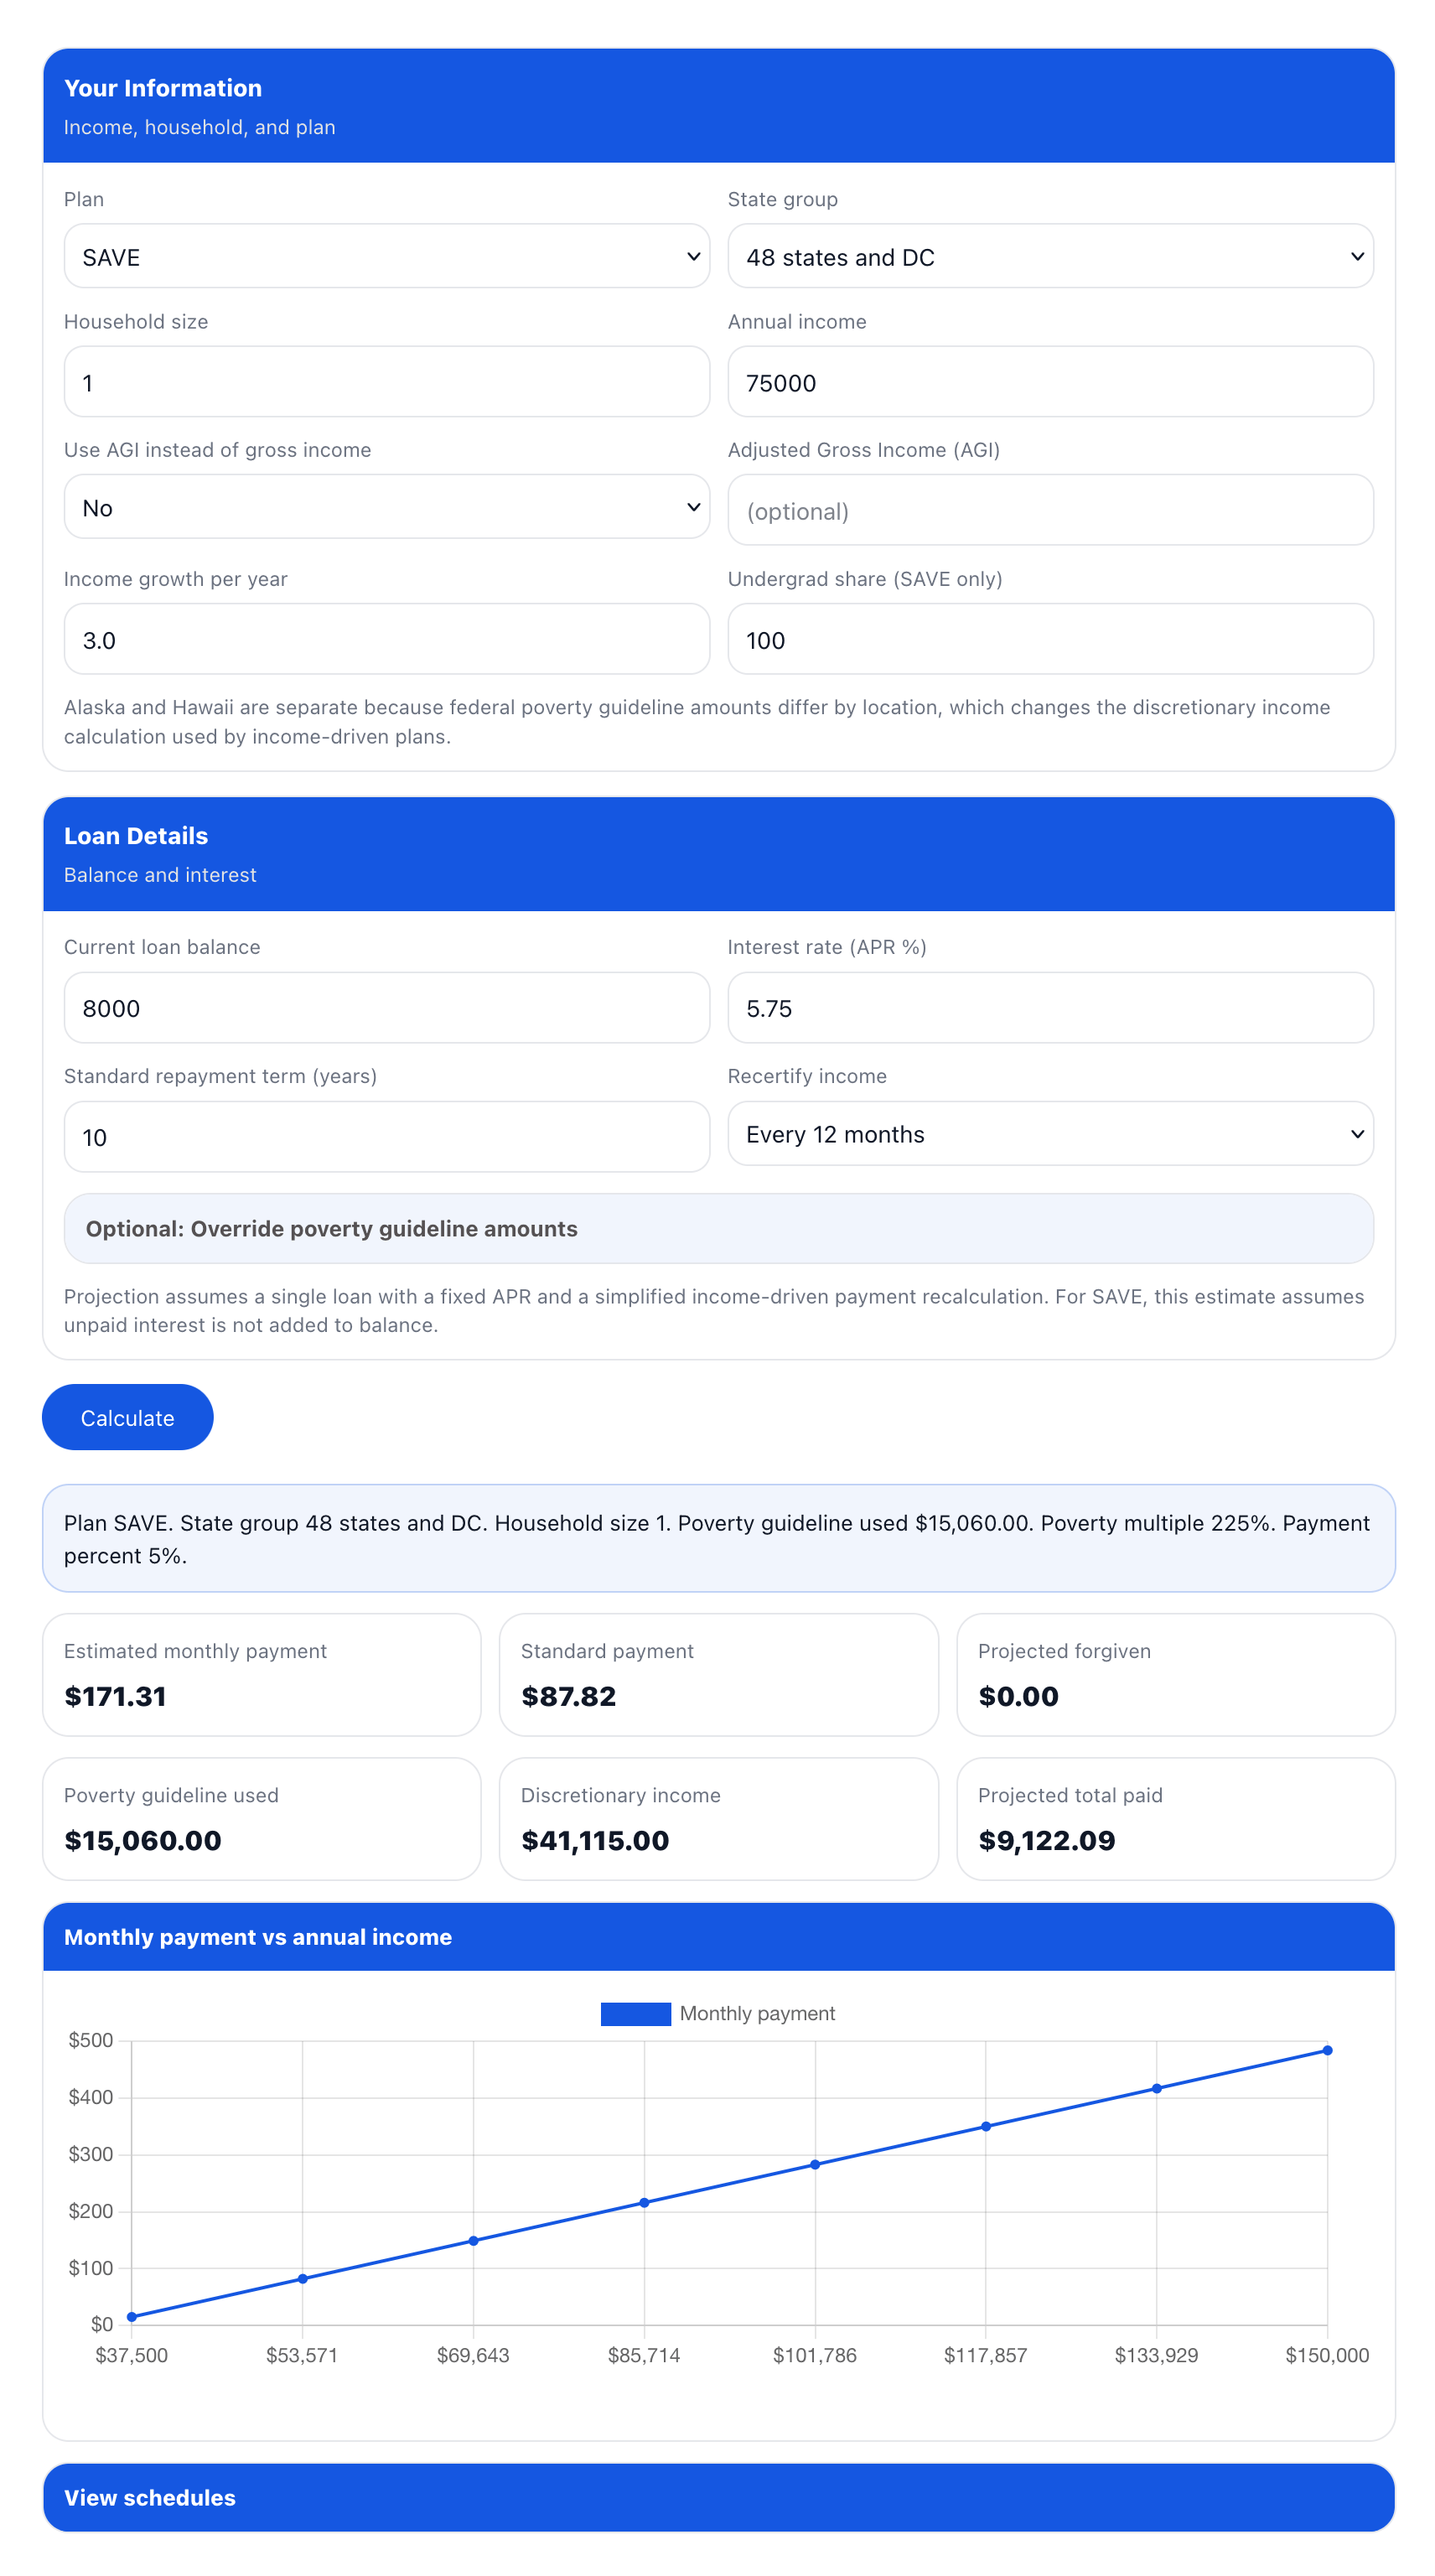
Your Information
Income, household, and plan
Loan Details
Balance and interest
Optional: Override poverty guideline amounts
View schedules
| # | Payment | Interest | Principal | Ending balance |
|---|
| # | Payment | Interest | Principal | Ending balance |
|---|
Calculating Income Based Repayment for Student Loans
Start with a quick input check before you calculate –
The calculator uses a few key inputs to generate the estimate, so it’s worth doing a fast check first. Confirm the plan, state group, household size, and income type you want to use, then confirm the loan balance and APR. This prevents the most common mistakes, like selecting AGI but leaving the AGI field blank, or entering an interest rate in the wrong format. In the next steps, each field is explained in detail so you know what to enter and how it affects the estimate.
- Plan selection – Pick the plan you want to estimate before filling everything else, because it changes the payment percent and projection length.
- State group – Choose 48 states and DC, Alaska, or Hawaii because poverty guideline amounts differ and that changes the discretionary income math.
- Income type – If AGI is selected, enter AGI. If AGI is not selected, enter annual income.
- Loan basics – Enter balance and APR as a percent value, for example 5.75, not 0.0575.
Choose the repayment plan and understand what changes when you switch plans –
The plan selection changes the math used for discretionary income and the share of that income applied to payments. It also changes the forgiveness timeline used in the projection. Selecting the closest match to your real repayment plan keeps the estimate meaningful, especially when you compare the income-driven projection against the standard schedule.
- SAVE – Uses a higher poverty guideline multiple. Payment percent depends on undergraduate share, with a weighted rate when undergrad and grad are mixed. The projection assumes unpaid interest does not increase the balance.
- PAYE – Uses a fixed payment percentage applied to discretionary income with its plan timeline used for the projection.
- IBR – Uses its plan rules for discretionary income and its forgiveness timeline, which can change long-run totals even when the monthly payment looks similar to PAYE in some cases.
- ICR (simplified) – Uses the simplified method in the calculator for planning comparisons, with a higher payment share and a different poverty multiplier than SAVE.
- When SAVE fits best – You want an estimate that reflects a higher poverty guideline multiple and a payment rate that can be lower for undergraduate debt.
- When PAYE or IBR fits best – You want a fixed percentage-of-discretionary-income estimate that typically produces a higher payment than SAVE for the same inputs, with different forgiveness timelines depending on the plan.
- When ICR fits best – You want a comparison point that uses a higher payment share and a different discretionary income setup, using the simplified ICR option shown in the calculator.
Set state group and household size, then connect it to poverty guideline math –
Select the state group and enter your household size. The calculator uses those two inputs to pick a poverty guideline amount, and then uses a plan-specific multiple of that guideline to calculate discretionary income. Since discretionary income drives the payment calculation, these fields can noticeably change the estimate.
- Alaska and Hawaii – Higher guideline amounts often reduce discretionary income, which can reduce the estimated payment.
- Household size impact – Increasing household size increases the guideline amount, which often reduces discretionary income.
- Common mismatch – If the result looks too high, re-check household size first because it is easy to leave it at 1 by accident.
Enter income or AGI, using the toggle the same way you would in real life –
Fill annual income if you want to estimate from gross income. If you want to estimate from AGI, switch “Use AGI instead of gross income” to Yes and enter AGI. When AGI is selected, the calculator uses AGI as the income input and ignores the annual income field for calculation. This step is where many calculators become confusing, so keeping the toggle and the field in sync matters.
- AGI selected – Enter a number in the AGI field, otherwise the calculator cannot compute and will warn you.
- AGI not selected – Enter annual income. The AGI field can stay blank without affecting the calculation.
- Good consistency – Use the same income type across scenarios so your plan comparisons stay meaningful.
Set income growth and recertification to shape the projection timeline –
The projection section estimates how payments and balances could change over time. “Income growth per year” increases income once per year inside the projection. “Recertify income” changes how frequently the projection updates the payment using the income assumption. These settings do not change the first-month estimate as much as they change the long-run totals and the projected forgiven amount.
- Income growth per year – A higher value usually pushes payments up over time and can reduce the projected forgiven balance.
- Recertify income – More frequent updates can make the projection react faster to income changes.
- Scenario planning – Try 0% growth and a realistic growth rate to see a range of outcomes.
Enter loan details so the schedules and totals have realistic interest behavior –
Enter your current loan balance and APR, then choose a standard repayment term in years. The balance and APR drive the interest part of both schedules. The standard term is used to calculate the standard payment and build the standard amortization schedule so you can compare an income-driven estimate against a fixed-payment payoff timeline.
- Balance – Sets the starting point for both schedules and for the projected forgiven amount.
- APR – Drives the interest calculated each month in both schedules.
- Standard term – Sets the payoff length and payment size for the standard schedule comparison.
Use the poverty guideline override to keep the calculator usable in future years –
Open the “Override poverty guideline amounts” section if you want to replace the built-in guideline numbers with updated values. This is the main long-term control that keeps the calculator usable when official guideline amounts change. You can update the household size 1 guideline and the add-per-additional-person value for each state group.
- When to leave it blank – Built-in defaults will be used automatically.
- What to enter – The household 1 guideline and the add-per-person amount for 48 and DC, Alaska, and Hawaii.
- Why it matters – Changing the guideline changes discretionary income, which changes the monthly payment estimate.
Click Calculate and read the summary line before you judge the numbers –
Click Calculate and start with the summary sentence shown at the top of results. It lists the plan, state group, household size, poverty guideline used, poverty multiple, and payment percent used. This is your quick verification that the calculator used the rule set you intended. After that, review the key output tiles.
- Summary verification – Confirms the plan logic and poverty guideline settings used for the estimate.
- Estimated monthly payment – The main IDR-style estimate based on your income inputs and plan settings.
- Discretionary income – Shows the amount used as the base for the payment percent calculation.
- Projected total paid and projected forgiven – Useful for comparing scenarios over a full projection timeline.
Use the chart to understand how sensitive the payment is to income changes –
The chart plots estimated monthly payment across a range of incomes around your entered income. This makes it easier to understand how the monthly payment changes if your income is lower or higher than expected. It is especially useful for people with variable income or for planning around future raises.
- What it shows – A set of income points with the matching estimated monthly payment for the selected plan.
- How to use it – Look for how steeply payments rise across the income range to understand sensitivity.
- Best use case – Compare two plans with the chart in view to see how each plan reacts to the same income range.
Open “View schedules” and compare month-by-month behavior –
Expand “View schedules” to see two tables. One table is the income-driven projection schedule, which uses your plan selection, poverty guideline settings, income growth, and recertification assumption. The second table is a standard amortization schedule for the term you entered. This section is where you can see balance behavior month by month instead of only totals.
- Income-driven projection schedule – Shows payment, interest, principal, and ending balance each month under the simplified IDR projection.
- Standard amortization schedule – Shows the same fields for a fixed-payment payoff plan.
- What to watch – Whether the projected payment covers monthly interest, and how the ending balance changes over time.
Share or export results so you can compare scenarios properly –
Use Share to generate a link that preserves your inputs, then open it later or send it to someone for the same scenario. Use Export to download CSV, Excel, or PDF files. The exports include the summary and both schedules, so you can compare multiple runs in a spreadsheet, or store a complete report in PDF form.
- Share link – Useful for saving a scenario without taking screenshots or retyping inputs.
- CSV and Excel – Useful for comparing multiple scenarios side by side, including schedules.
- PDF – Useful for a clean report with summary, chart image, and both schedules in one file.
Tips
- Run two scenarios using the same inputs: Keep income, household size, and loan details the same, then switch only the plan. This shows how plan rules change the estimate without mixing variables.
- Keep income format consistent across tests: If you type gross income for one run, keep using gross income for later runs. Switching between gross income and AGI mid-comparison can make results look inconsistent.
- Use a realistic income growth number: If your income tends to rise through raises or job changes, add a conservative percentage. If your income is irregular, keep growth at 0 to avoid a misleading projection.
- Use the chart to spot payment sensitivity: The chart quickly shows how payments change as income rises. If the line rises sharply in your range, small income changes may noticeably affect payments.
- Use the schedules to compare total direction, not exact cents: The projection is simplified, so focus on the pattern. Look at whether balances trend downward, level off, or stay high through the projection window.
- Export after each scenario and rename files: Export once per plan or assumption set, then rename files like “SAVE-75k-HH2” or “PAYE-AGI-60k.” It makes comparisons faster later.
- If the exported PDF feels long, focus on summary plus first pages: The summary and early schedule rows usually give enough clarity for planning. The full schedule remains available if needed for deeper comparison.
Important
- This calculator gives planning estimates, not official servicer results. Real payments can differ based on how your servicer defines income, what gets counted in household size, and how your loans are grouped.
- Plan rules can change over time. If a plan’s payment percent, poverty multiple, or forgiveness timeline is updated by policy, your future payment under that plan may not match the estimate.
- ICR is marked “simplified” for a reason. ICR can involve alternate calculations that depend on more details than the calculator asks for, so treat that plan’s output as a rough directional check.
- AGI can be lower than gross income, but only if the AGI field is filled. If you select AGI and leave it blank, the calculator cannot compute correctly because it has no income value to use.
- Household size and state group directly change the poverty guideline amount. A wrong household size or wrong Alaska or Hawaii selection can shift the payment materially.
- The SAVE interest behavior here is simplified. The estimate assumes unpaid interest is not added to the balance. Actual interest treatment can depend on servicer processing and timing.
- Recertification timing changes the projection shape. Monthly recertification is an estimate mode. Most borrowers recertify on a schedule set by program rules, so use the schedule choice mainly to see how sensitive payments are to income updates.
- Loan balance and APR matter for the schedule and forgiveness projection. If balance or APR is off by even a small amount, the projected remaining balance and “forgiven” number can swing noticeably.
- Taxes on forgiveness are not handled. Some forgiveness can have tax consequences depending on the year and rules in effect. Plan your cash flow with that possibility in mind.
FAQs
Income-driven repayment means the monthly payment is calculated from your income, household size, and a poverty guideline amount tied to your location. The calculator applies those inputs to the selected repayment plan’s rules to estimate a monthly payment and a long-term projection.
Federal poverty guideline amounts differ for Alaska and Hawaii compared to the other states and DC. Since discretionary income depends on the poverty guideline, selecting the correct state group changes the payment estimate.
Discretionary income is the portion of your income above a percentage of the poverty guideline for your household size. The calculator subtracts the applicable poverty multiple from your income, then applies the plan’s payment percentage to that amount.
Each plan uses different rules for poverty multiples, payment percentages, and forgiveness timelines. The calculator applies those rule differences so you can see how payments and long-term outcomes vary by plan.
SAVE uses different payment percentages for undergraduate and graduate debt. The undergrad share adjusts the payment percentage as a weighted average when your balance includes both types.
The income-driven schedule shows how payments and balances change under the selected IDR plan. The standard schedule shows what repayment looks like under a fixed-term amortization, which helps compare affordability and total cost.
Projected forgiven is the estimated remaining balance at the end of the plan’s forgiveness period. This is a simplified projection and does not account for potential tax treatment or administrative adjustments.
Income growth increases future payments in the projection. The calculator applies the growth rate annually to show how rising income can change monthly payments and reduce or eliminate forgiveness over time.
Poverty guideline values change over time. The override fields let you apply updated or custom guideline amounts without changing the calculator’s logic, which keeps estimates usable in future years.
The SAVE plan’s unpaid interest behavior is simplified. The calculator assumes unpaid interest does not increase the balance, which reflects the intent of the plan but may differ in real-world timing.
Yes. As long as plan rules remain similar, the calculator stays usable. The poverty guideline override and adjustable inputs are designed to keep the calculation relevant even when baseline numbers change.
Yes. CSV, Excel, and PDF exports include both the income-driven projection schedule and the standard amortization schedule so the results can be reviewed or shared offline.


