
3-Circle Venn Diagram Templates
Three circles, seven regions, and a center where all three meet that is usually the whole point. These 3-circle Venn diagram templates have the sets and regions drawn and aligned, so you label the circles and drop in your data. Pick one and start mapping your three sets.


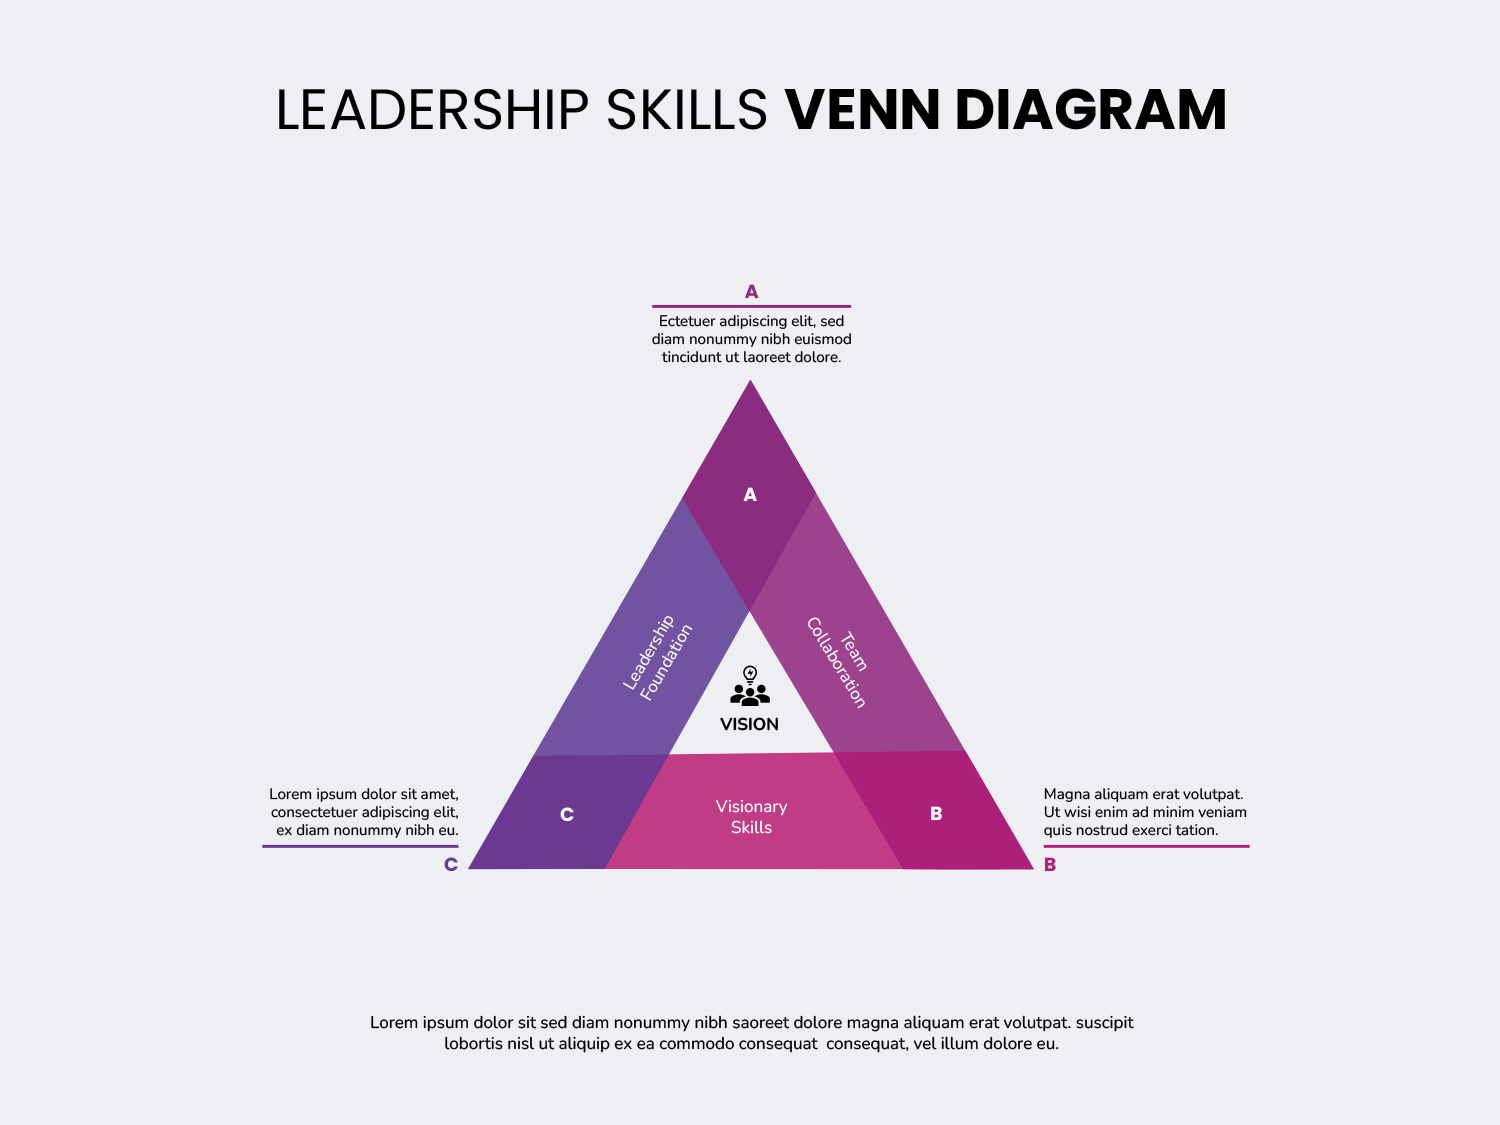
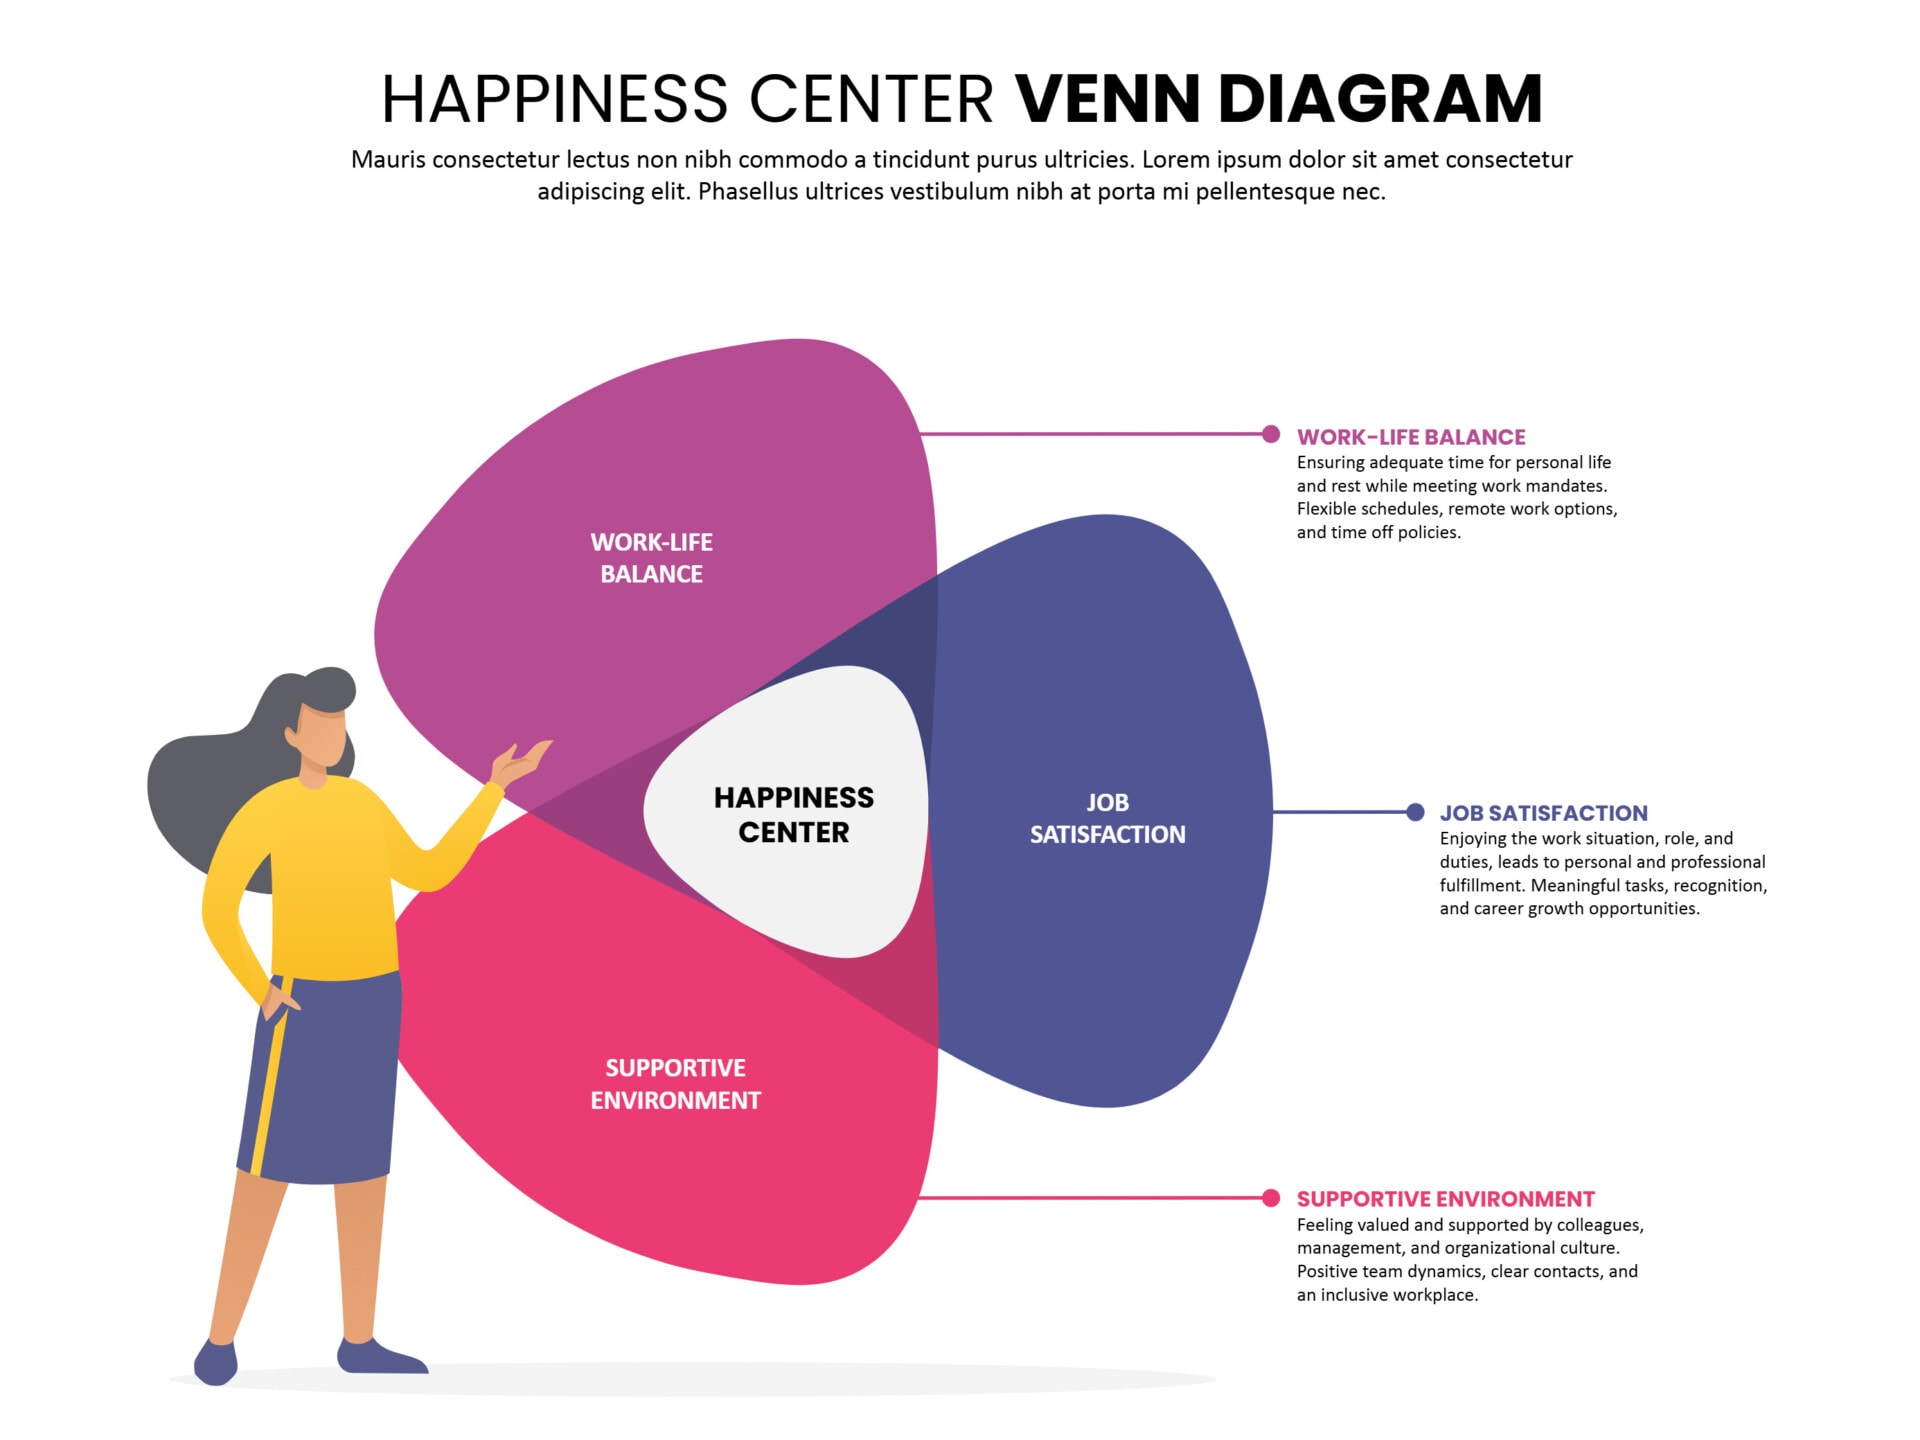


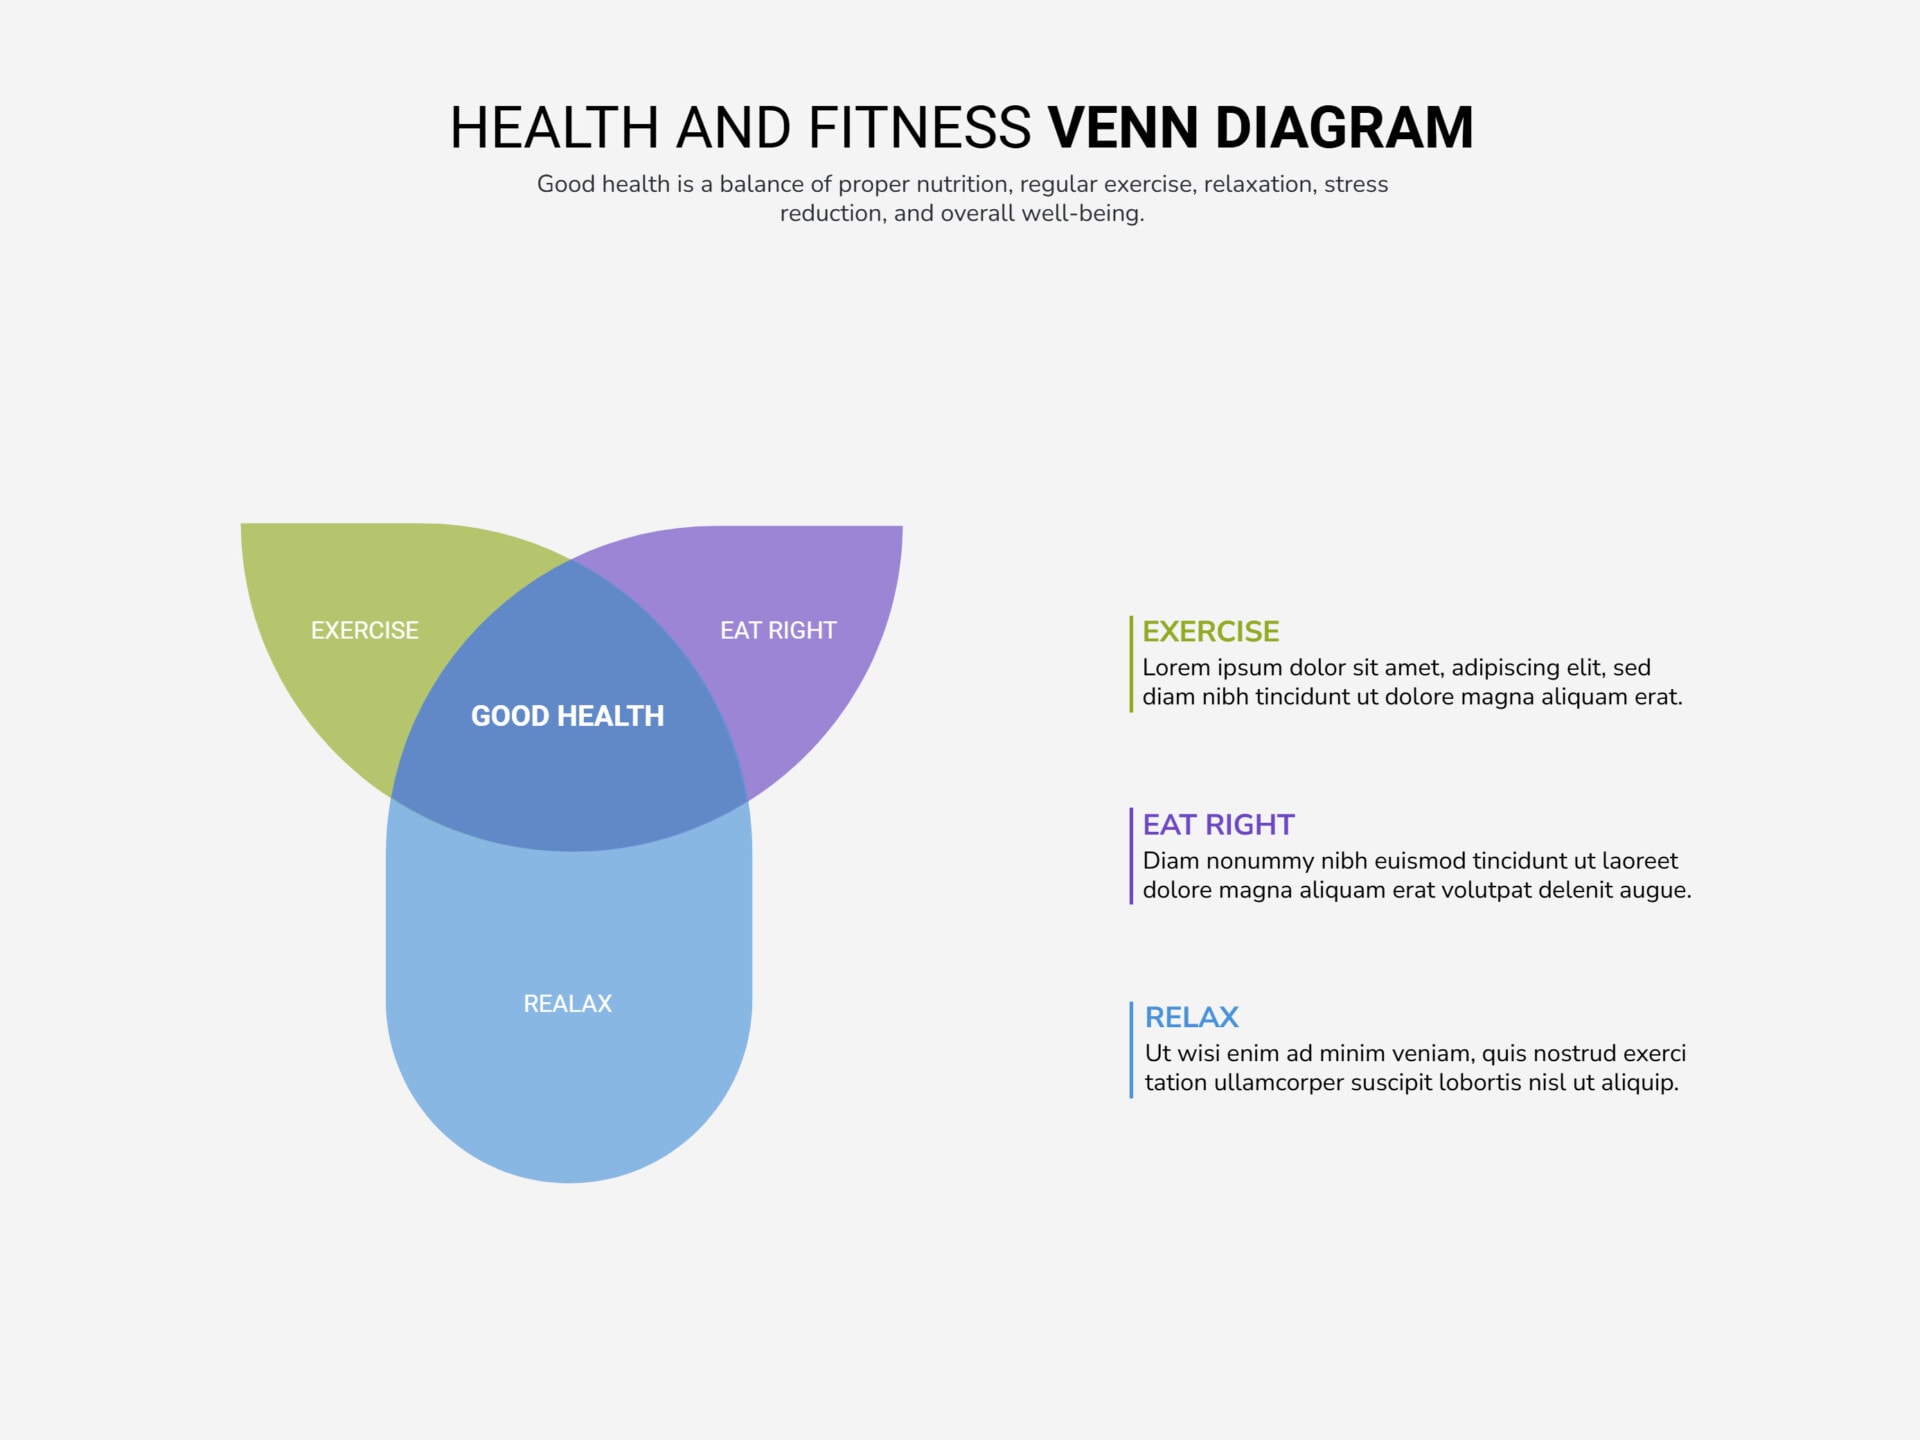


A three-circle Venn diagram compares three sets at once, and the reason it is so widely used is the center, where all three circles overlap. That small middle region is often the answer people are really looking for. It is the sweet spot, the shared trait, the option that satisfies every requirement. Three circles produce seven distinct regions in total, three for what is unique to each set, three for each pair that overlaps, and one in the middle for all three, and a good template keeps those regions clear instead of letting them collide.
These 3-circle Venn diagram templates are built around that structure, with the circles sized and positioned so every region is large enough to label and read. They suit the comparisons three sets are made for, weighing three options against shared criteria, mapping where three groups or ideas intersect, or finding the overlap that matters in a marketing, planning, or teaching context. You set the three sets and what falls into each region, and the diagram keeps the relationships legible as you go.
Worth knowing: The center region, where all three sets overlap, is the one most diagrams are built to reveal, so define what belongs there first. Working outward from the center keeps the rest of the diagram focused on the point you are making.
Elements of a 3-circle Venn diagram
The seven regions a three-circle diagram is made of, and what each one is for.
Three circles, each one category, group, or option being compared. The three sets set the terms of the comparison, so naming them well is what keeps the seven regions inside them readable.
The three outer areas where a circle does not overlap. Each shows what belongs to that set alone and what makes one category distinct from the other two.
The three regions where two circles meet, showing what each pair shares but the third set does not. They reveal the partial agreements that a two-set diagram cannot show.
The middle region where all three circles overlap, holding what every set has in common. This is the sweet spot most three-circle diagrams are built to reveal, often the answer you are after.
Set names, a title, and a short legend where useful. With seven regions in play, clear labeling is what lets a reader follow the comparison without it being explained to them.
Building a 3-circle Venn diagram
From three defined sets to a finished diagram, working with these templates.
Decide the three categories you are comparing and name each one. Three sets that are genuinely distinct but share some ground are what make a three-circle diagram worth using over two.
Put a clear name on each circle before adding anything inside. A reader should grasp what the three sets are from the labels alone.
Fill the three outer regions with the items that belong to only one set. This establishes what makes each category distinct before you map the overlaps.
Move to the pairwise regions, what each pair of sets shares, then the center, what all three have in common. The center is usually the point of the whole diagram, so give it the most thought.
Adjust text size and wording so every region, especially the smaller overlaps, stays legible. If a region is too crowded, shorten the entries rather than shrinking the type.
Set the colors, fonts, and circle styling to fit your subject or brand. Distinct colors per circle help a reader track which set each region belongs to.
FAQs
When should I use a 3-circle Venn diagram instead of a 2-circle one?
Use three circles when you are comparing three sets and the relationships between them matter, particularly the center where all three overlap. If you only have two sets, a 2-circle diagram is clearer; a third circle adds value only when there is a real third category and meaningful overlaps to show.
What goes in the center where all three circles overlap?
The center is whatever is common to all three sets at once. It is often the most important region, the shared trait, the option that meets every criterion, the idea that satisfies all three goals, so it is worth defining first and building the rest of the diagram around.
How do I keep a 3-circle diagram from getting cluttered?
Keep the entries in each region short and limit them to what matters, since seven regions fill up quickly. Use a distinct color per circle so regions stay easy to track, and if a region gets long, trim the wording rather than shrinking the text.
Can I change the circle sizes or use a scaled version?
Yes. The circles, colors, and text are all editable, so you can resize them or use a scaled version where circle size reflects the relative size of each set. The templates give you an aligned starting point you can adjust to your data.