
Flowchart Templates
A flowchart turns a process into a picture, so anyone reading it can follow the steps in order and see where the path splits. These flowchart templates give you the standard symbols already placed and connected, the ovals for start and end, rectangles for steps, diamonds for decisions, and arrows showing direction. Drop in your own steps and the logic reads top to bottom at a glance. Open a template and start mapping your process.


A flowchart is a picture of a process. It uses a small set of agreed shapes to stand for the different kinds of steps, an oval where the process starts and ends, a rectangle for an action, a diamond where a decision splits the path, and arrows that join them to show the order. Because the shapes mean the same thing from one chart to the next, a reader who knows the convention can follow your logic without a key. That shared vocabulary is why flowcharts show up in process design, software planning, training material, and any setting where a sequence has to be explained once and understood by many.
These flowchart templates start from that standard set of symbols, already drawn and connected so the shapes mean what a reader expects. You replace the sample steps with your own, add or remove decision branches as the process requires, and keep the arrows running in one consistent direction. A short linear sequence and a longer one with several decision points both sit in the same readable flow as you build it out.
Worth knowing: Keep the whole chart reading in one direction, top to bottom or left to right, and label each decision branch with its answer such as Yes or No. A reader follows the arrows, so a consistent direction is what keeps a longer chart from turning into a tangle.
Flowchart elements
The standard symbols a flowchart is built from, and what each one means.
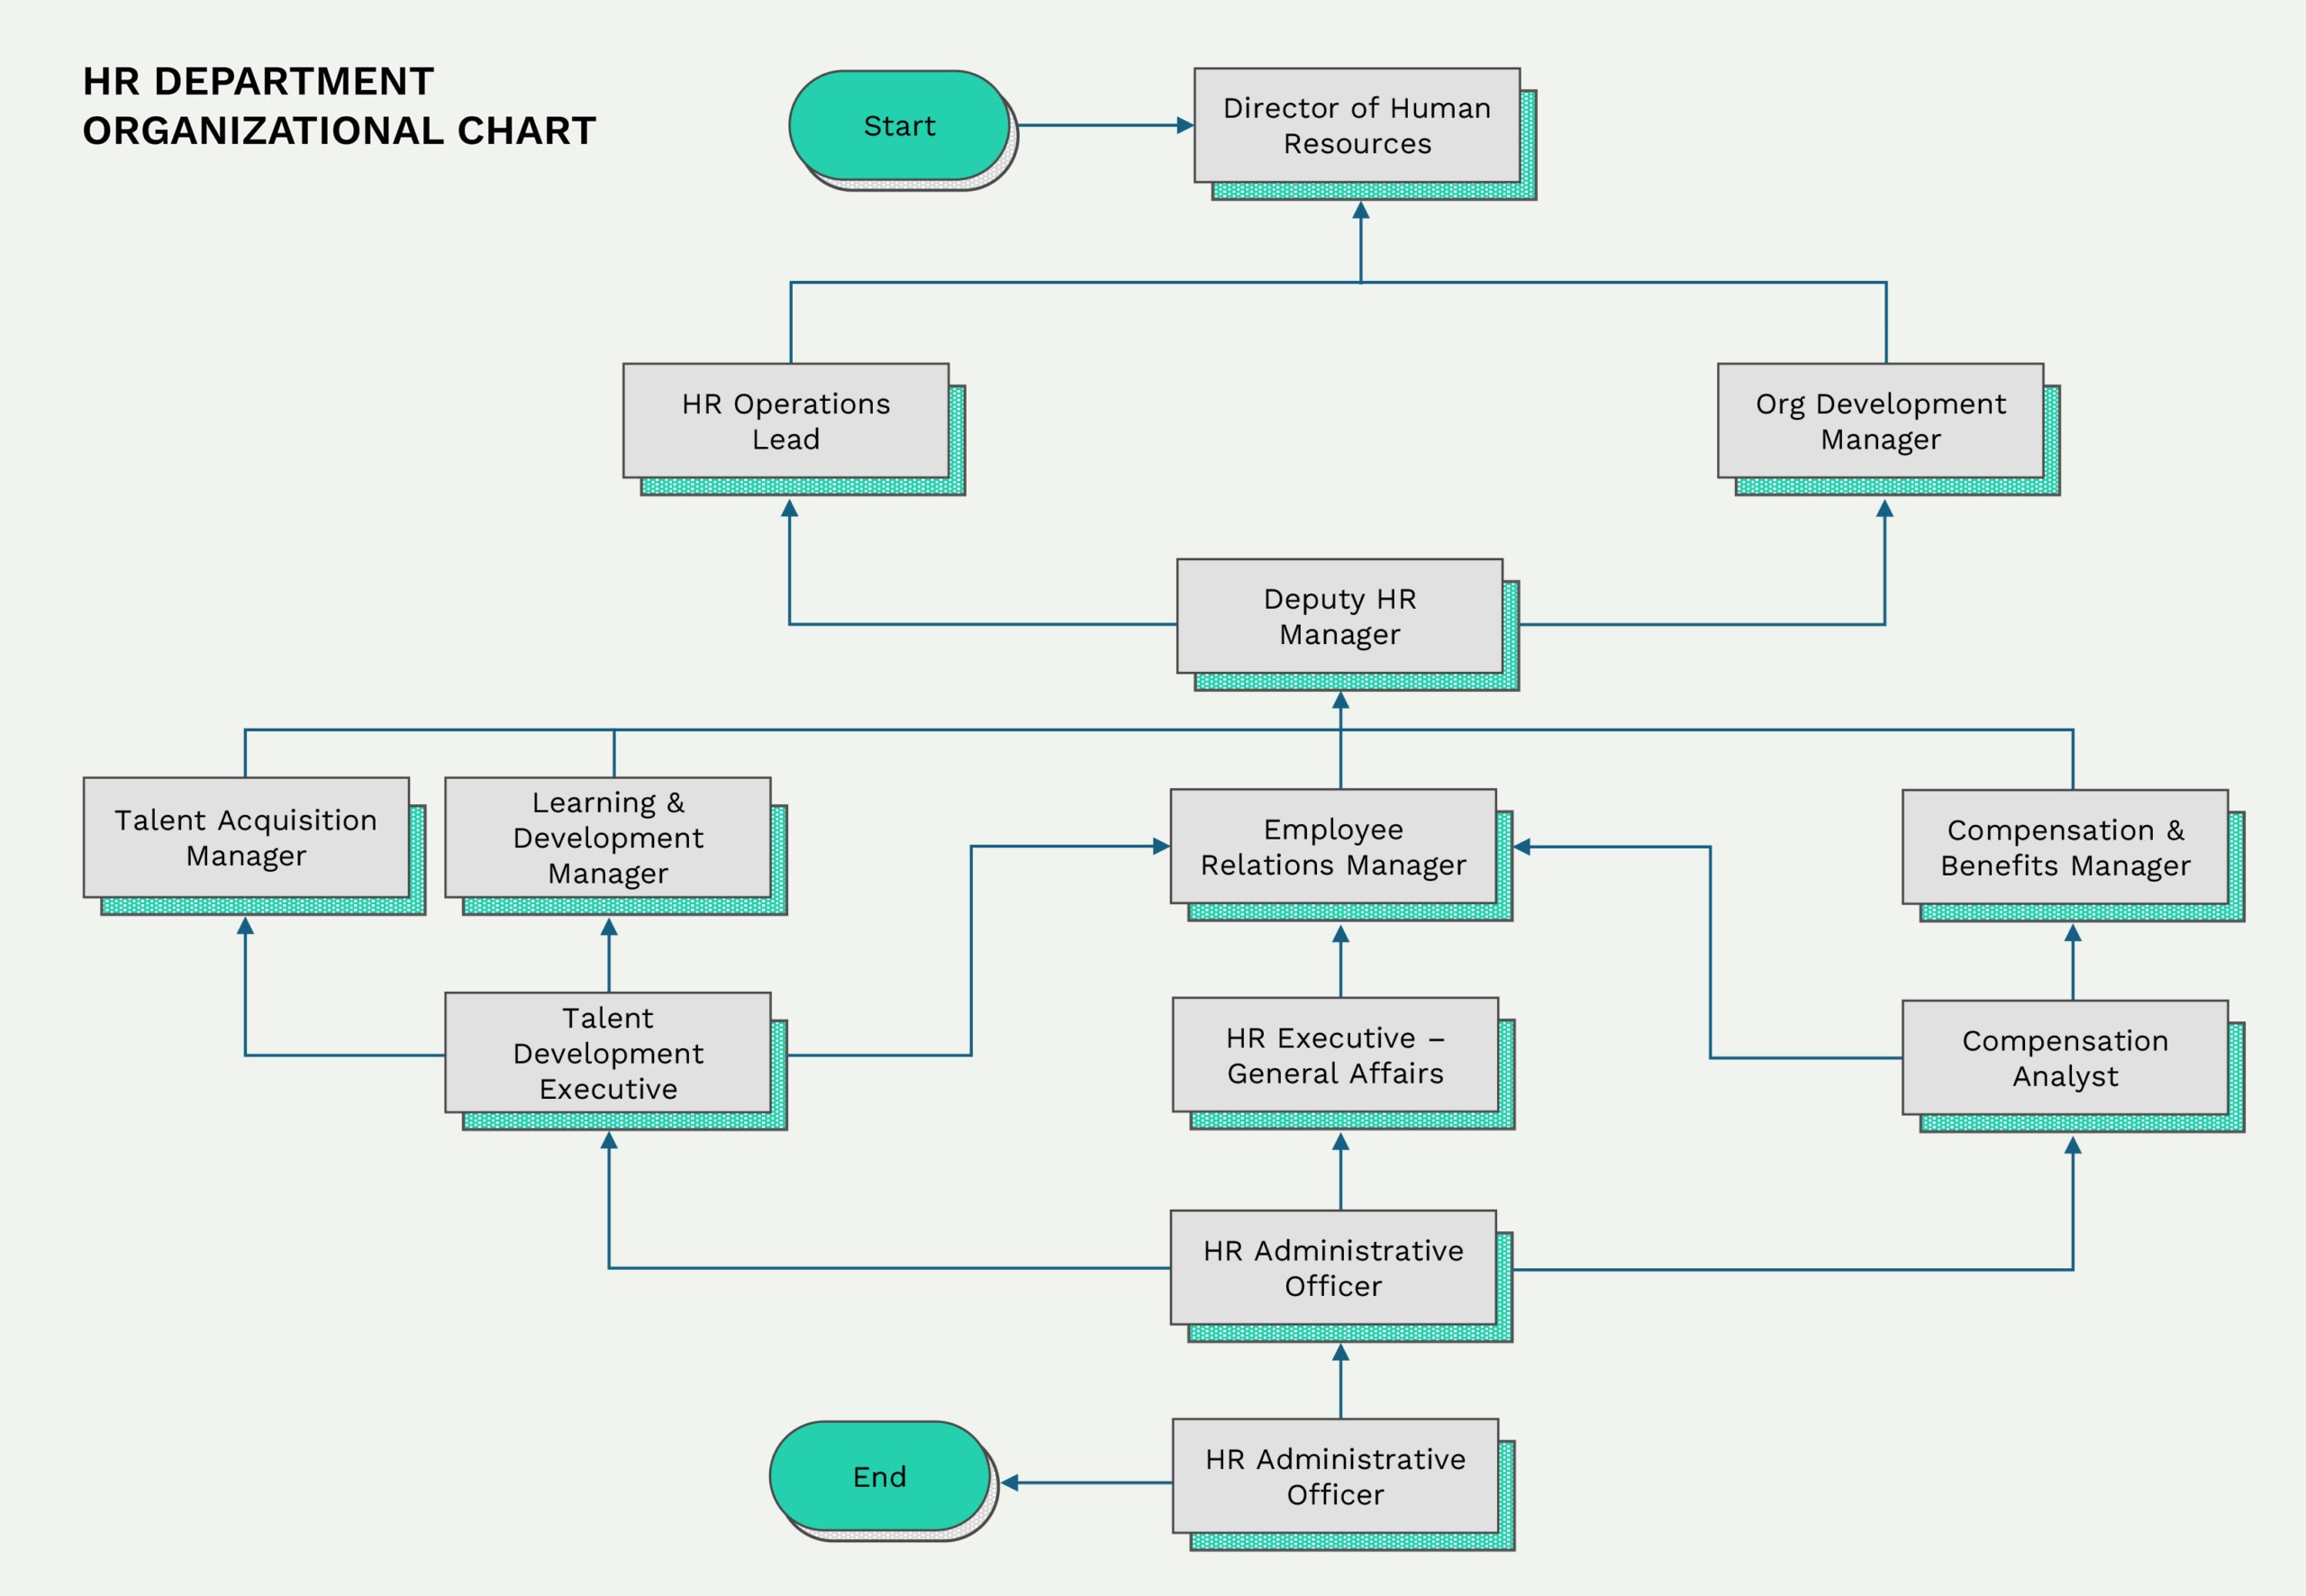
A rounded oval marking where the process starts and where it ends. Most charts have one start and one end, usually labeled Start and End.
A plain rectangle standing for a single action or step, such as Submit request or Print receipt. It is the most common shape on the chart.
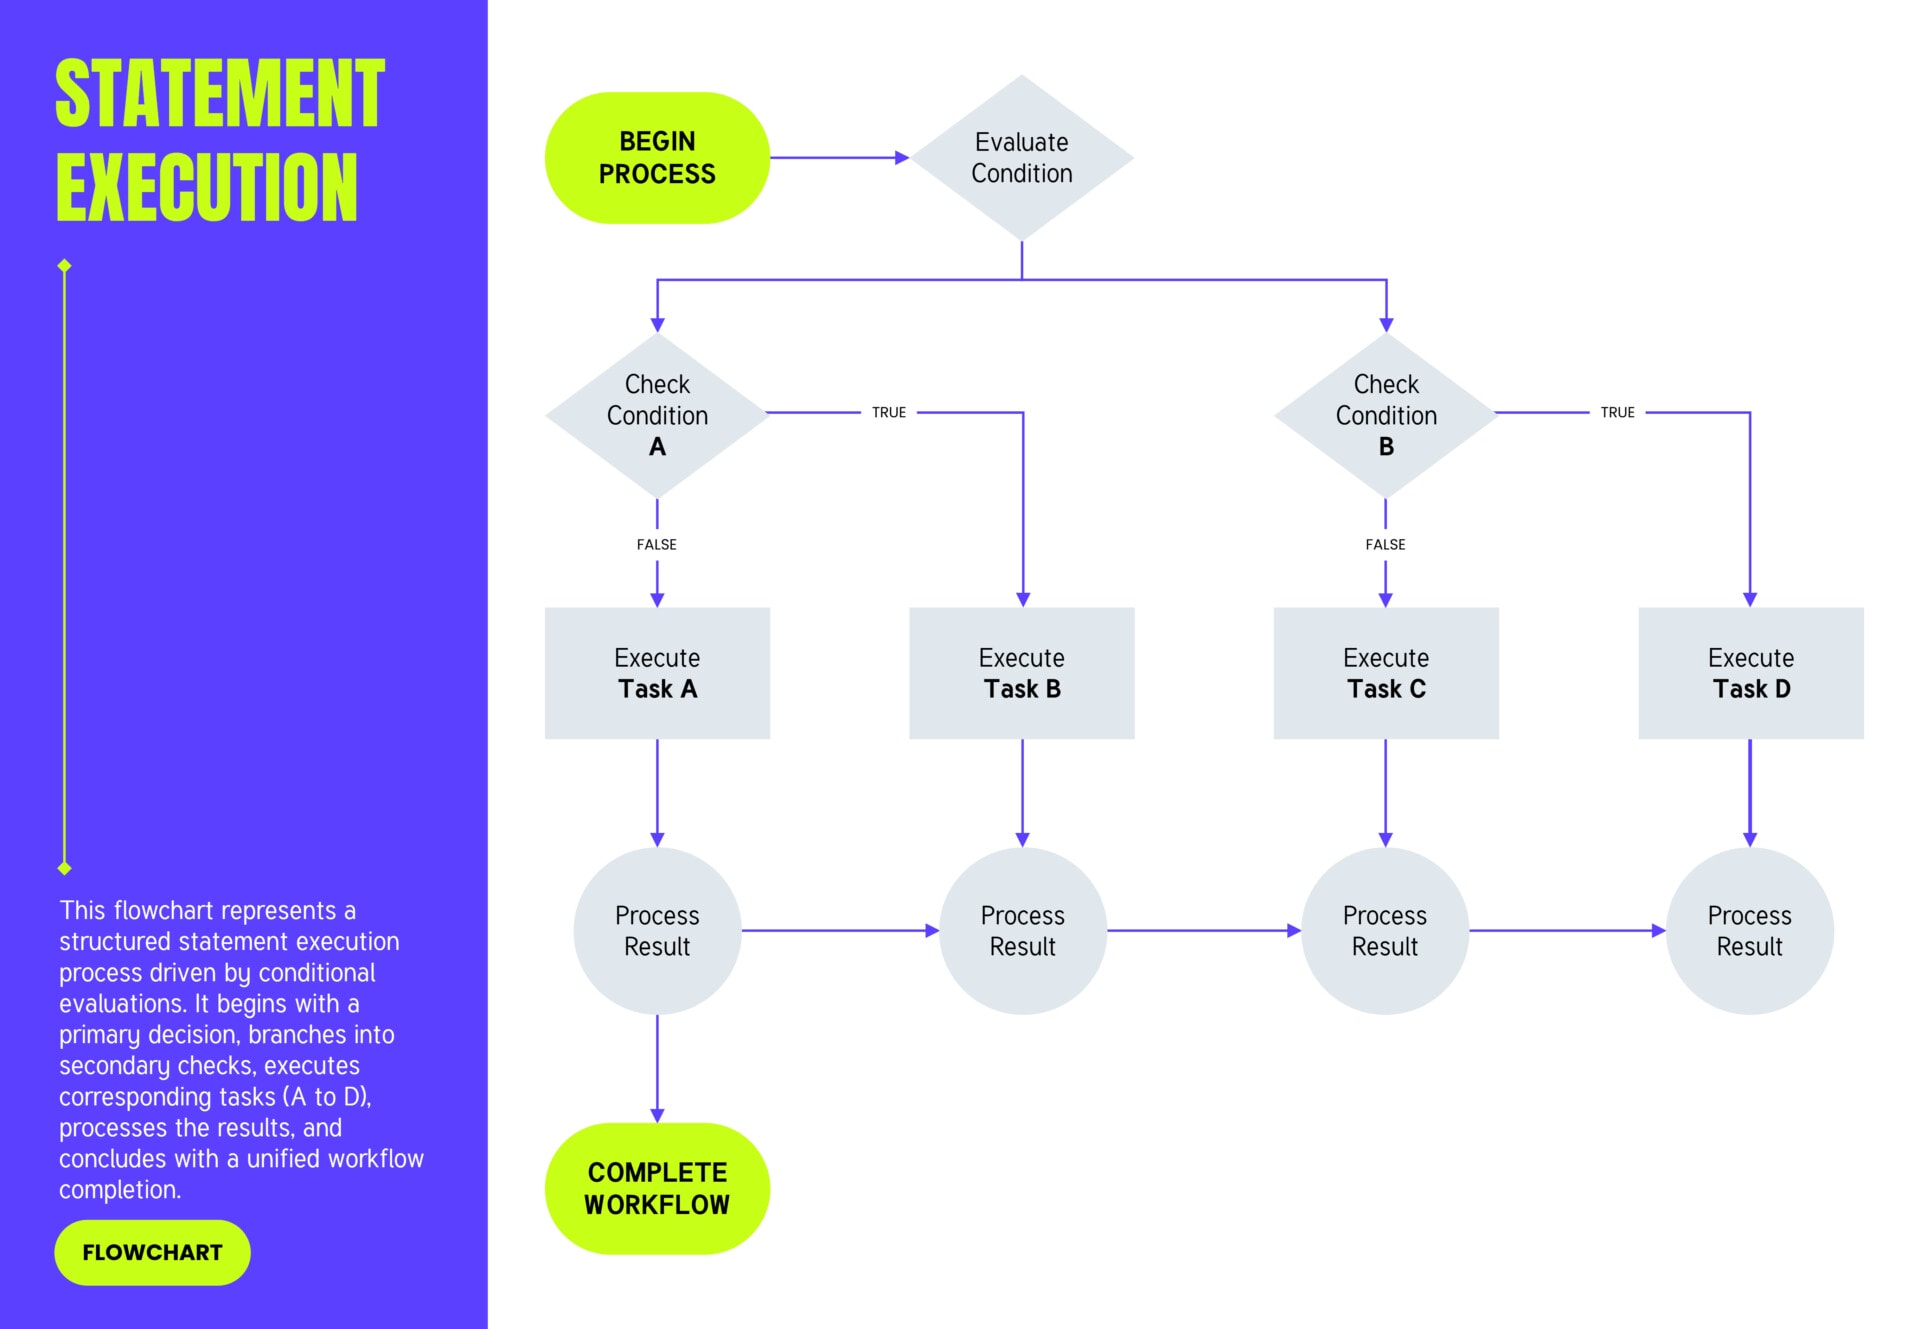
A diamond marking a question with two or more answers. One arrow comes in, and a separate labeled arrow leaves for each answer, such as Yes and No.
A slanted parallelogram for data entering or leaving the process, such as a typed entry or a displayed result.
An arrow joining one shape to the next and pointing in the direction the process moves. The arrows are what turn a set of shapes into a sequence.
A small circle that links two points without drawing a line between them, used to avoid crossing arrows. A matching letter or number marks each end of the pair.
A marker showing the flow continues on another page or screen, useful when a process runs longer than one view.
A rectangle with a wavy base standing for a written output such as a report or printed form produced by a step.
A rectangle with a bar down each side, standing for a step that is itself a separate flowchart, such as Run credit check. It lets a long process reference a subprocess without redrawing it.
Several document shapes drawn stacked, standing for a set of documents or reports rather than a single one, such as a batch of forms produced or reviewed at a step.
A quadrilateral with the top edge sloped up, marking a step where a person enters data by hand rather than the system supplying it, such as typing in a reading.
A hexagon for a setup or initialization step that has to happen before the main work can proceed, such as loading settings or preparing the conditions for the steps that follow.
A circle with a plus inside, marking a point where one path splits into several branches. It is easy to confuse with the summing junction, which uses an X and instead merges branches back into one.
A rectangle with one end rounded into a half-oval, standing for a planned wait or pause in the process, such as a holding period before the next step can run.
A few charts also reach for advanced shapes such as the data store (a cylinder) or manual operation, but most workflows read perfectly well with the symbols above. Where a chart uses a less familiar shape, a short legend keeps it readable.
Building a flowchart
From a defined start and end to a process a reader can follow in one pass.
Open the flowchart template closest to your process and place an oval where it begins and one where it finishes. Fixing both points first sets the boundaries of the chart and stops it from drifting beyond the process you mean to show.
Working from the start, swap the sample boxes for a rectangle per action in the sequence it happens. Keep each step to one action with a short verb phrase, such as Submit form, so the chart stays readable as it grows.
Where the path depends on an answer, place a diamond and phrase it as a question. Draw a separate branch for each answer and label it Yes, No, or whatever the answers are, so a reader knows which way to go at each split.
Tip — If a decision has more than two answers, one diamond with several labeled branches reads better than a chain of yes or no diamonds.
Join the shapes with arrows pointing the way the process moves. Every shape except the start should have an arrow coming in, and every shape except the end one going out, so there are no loose ends.
Let the whole chart read top to bottom or left to right. When a branch loops back, route the arrow cleanly rather than crossing lines, and use a connector circle for a long jump so the line does not tangle.
Set the colors, fonts, and shape styling in the template to fit your subject or team. Color can group related steps, though the shapes should still follow their standard meanings so the chart reads on its own. Then download or print it.
FAQs
What do the common flowchart symbols mean?
A few shapes do most of the work. An oval marks the start and end, a rectangle is an action or step, a diamond is a decision that branches, a parallelogram is data going in or out, and an arrow shows the direction the process moves. A circle acts as a connector that links two points without a drawn line. These meanings are widely recognized, which is why a reader can follow a chart built from them without a separate key.
What is the difference between a flowchart and a decision tree?
A flowchart maps a whole process from start to finish and can include loops, several decision points, and parallel steps along the way. A decision tree starts from one question and branches outward into outcomes, with no looping back. Put simply, a flowchart shows how a process runs, while a decision tree shows how one choice leads to a set of results.
How do I handle a decision that branches more than two ways?
A diamond is not limited to Yes and No. For a question with several answers, draw one branch per answer from the same diamond and label each one, for example Low, Medium, and High. This usually reads more cleanly than stacking a chain of two-way diamonds. If the answers themselves need further steps, each branch can run into its own part of the chart.
Do the arrows have a standard direction?
By convention a flowchart reads top to bottom or left to right, and the arrows follow that direction throughout. Keeping one direction is what lets a reader trace the path without backtracking. When a step has to return to an earlier point, the arrow can loop back, but the overall flow should still move one way so the loop reads as a deliberate exception.
Can I edit the shapes and labels in these templates?
Yes. The shapes, arrows, labels, and colors are all editable, so you can add or remove steps, rename them, and adjust the branches to match your own process. The templates give you the standard symbols already placed and connected, so you adjust the content rather than redrawing the structure from scratch.