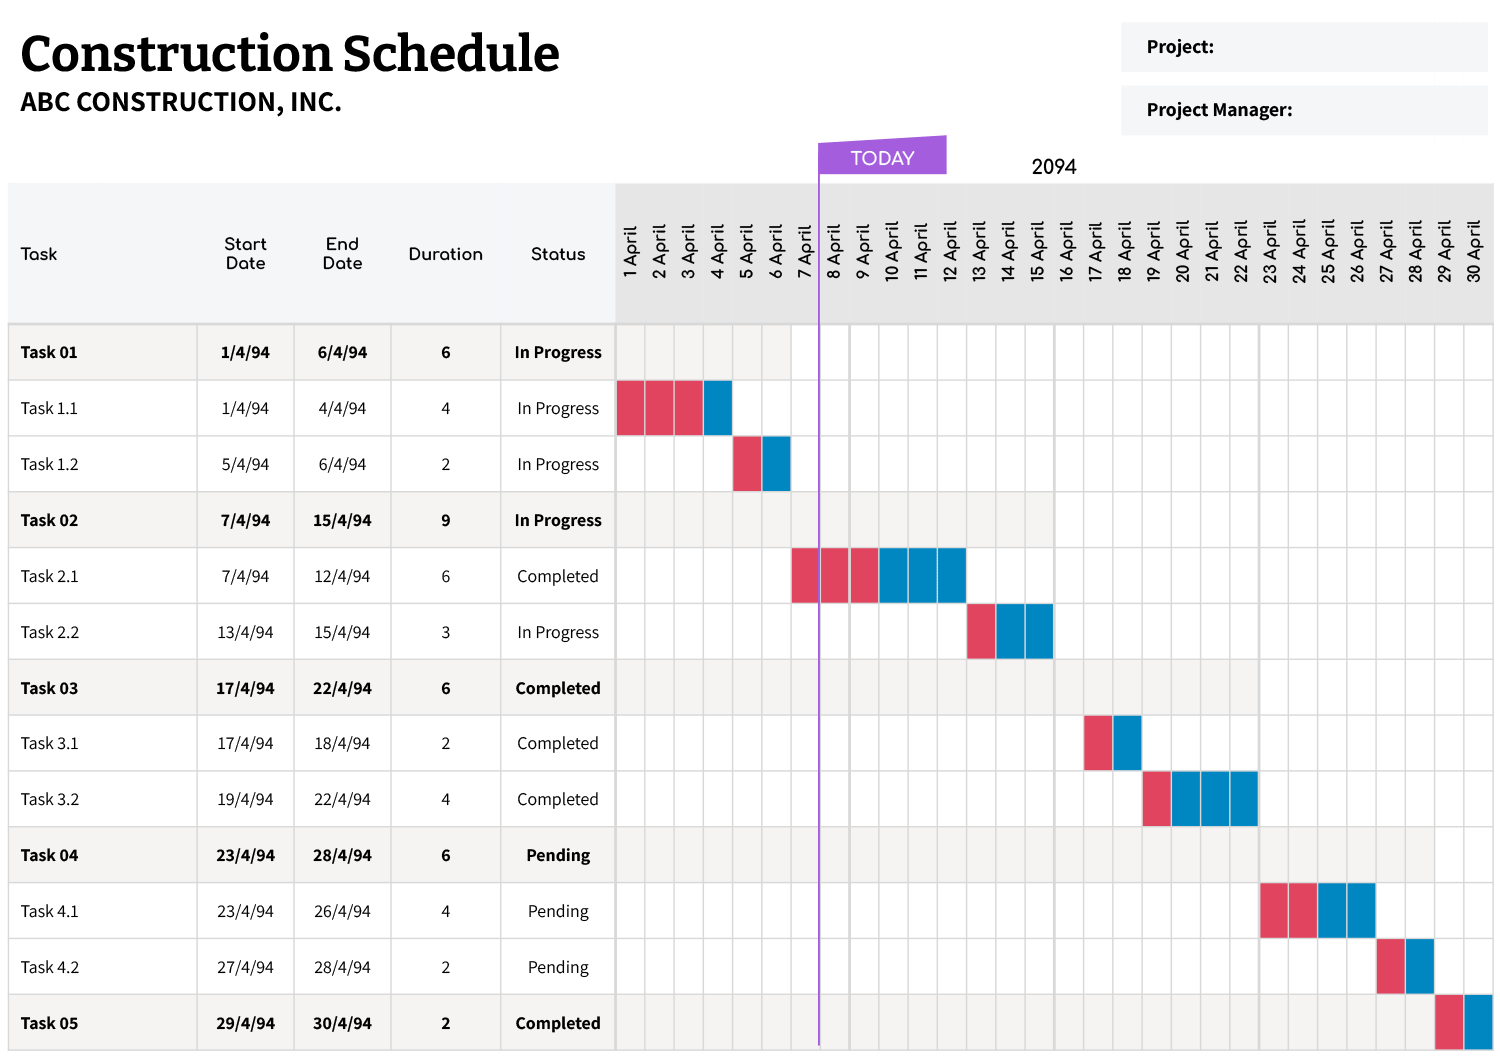
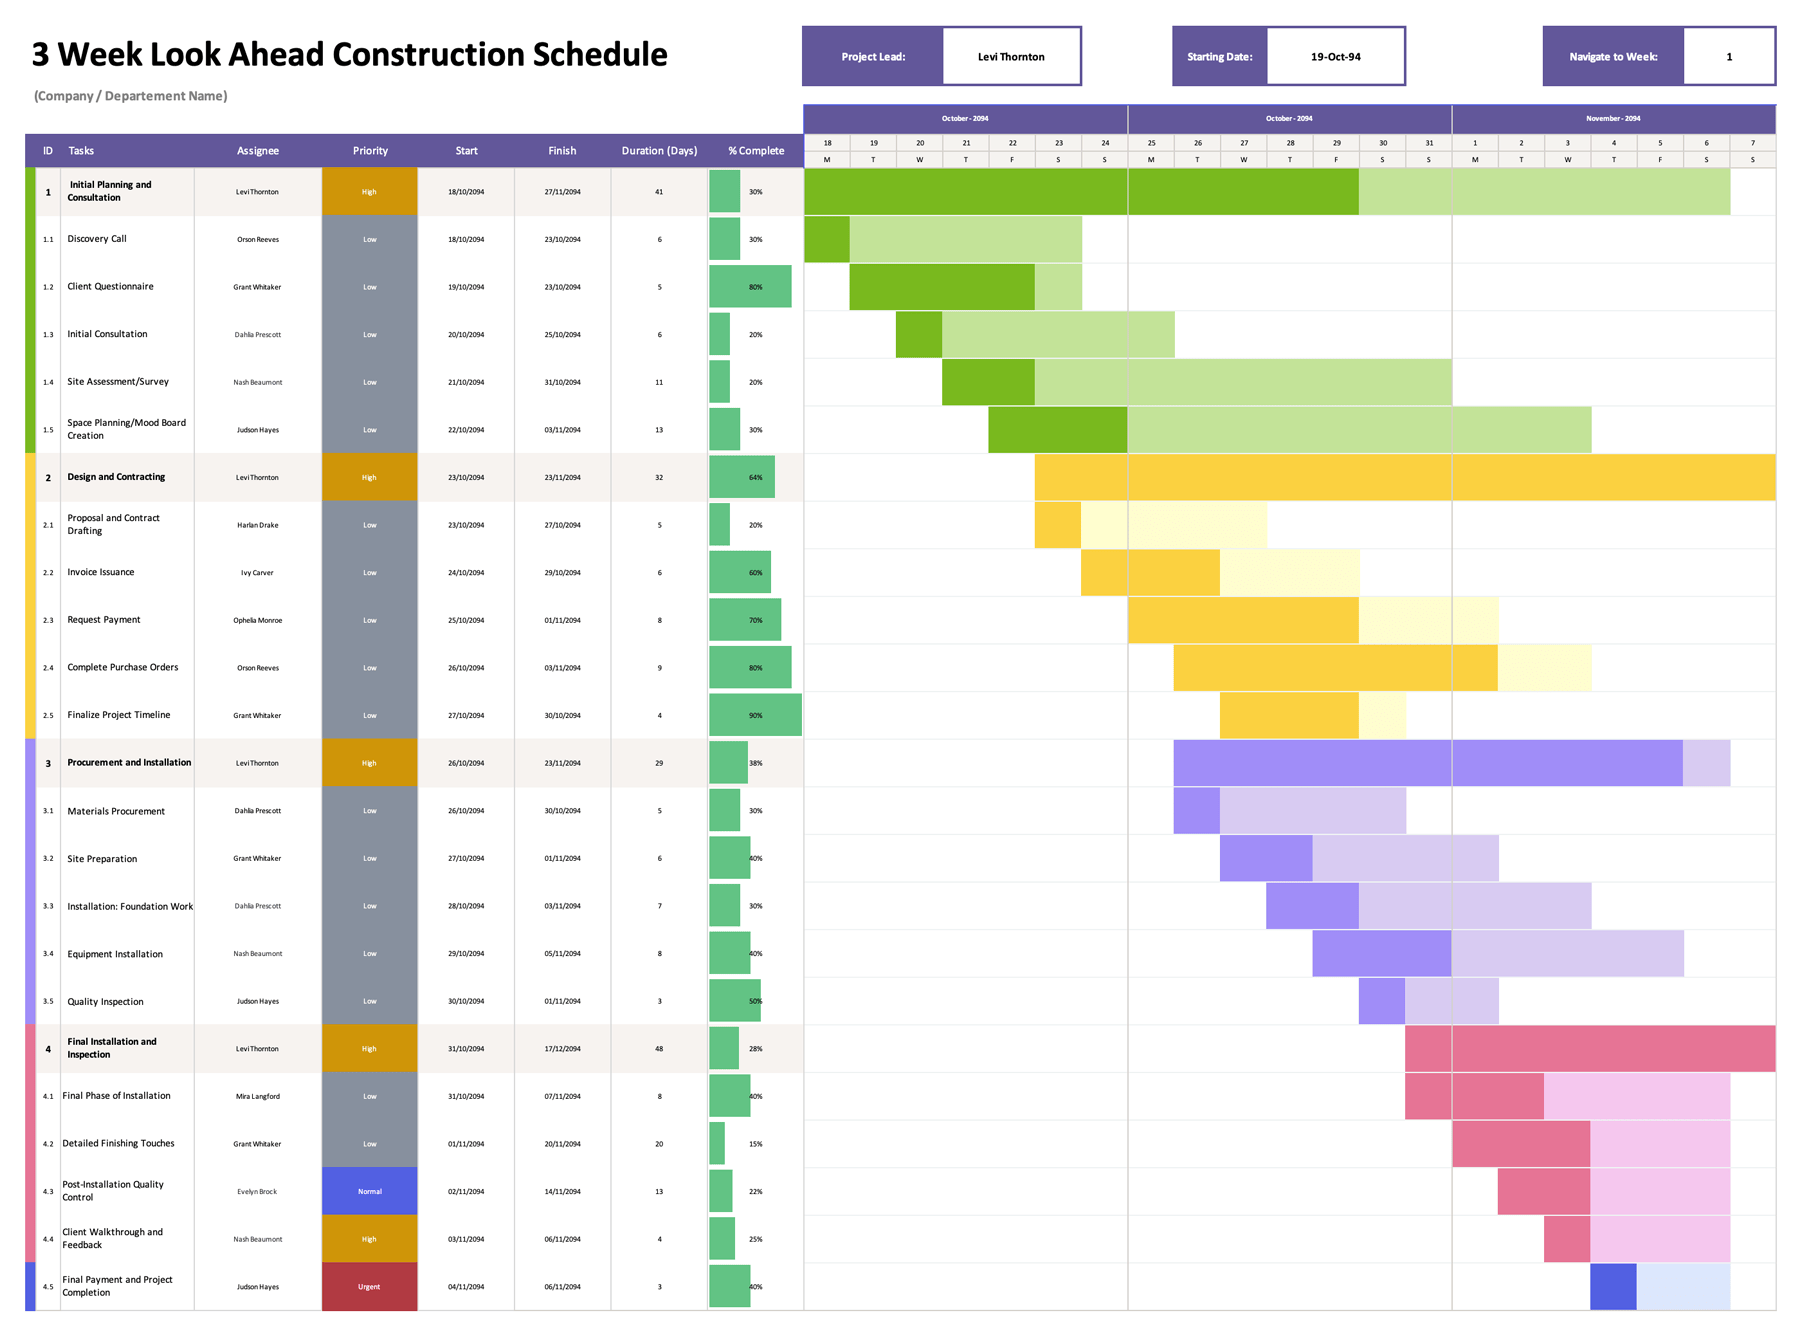
The construction draw schedule template provides a clear view of each phase and task, covering estimated costs, actual expenses, and any differences. It includes a Gantt chart to visually represent progress and task durations, simplifying the planning process while offering a detailed overview of draws.
To get started, you can update the basic fields, such as the start date and the project lead, to customize the Gantt chart for your specific needs. This customization helps you track each task as it progresses throughout the project.
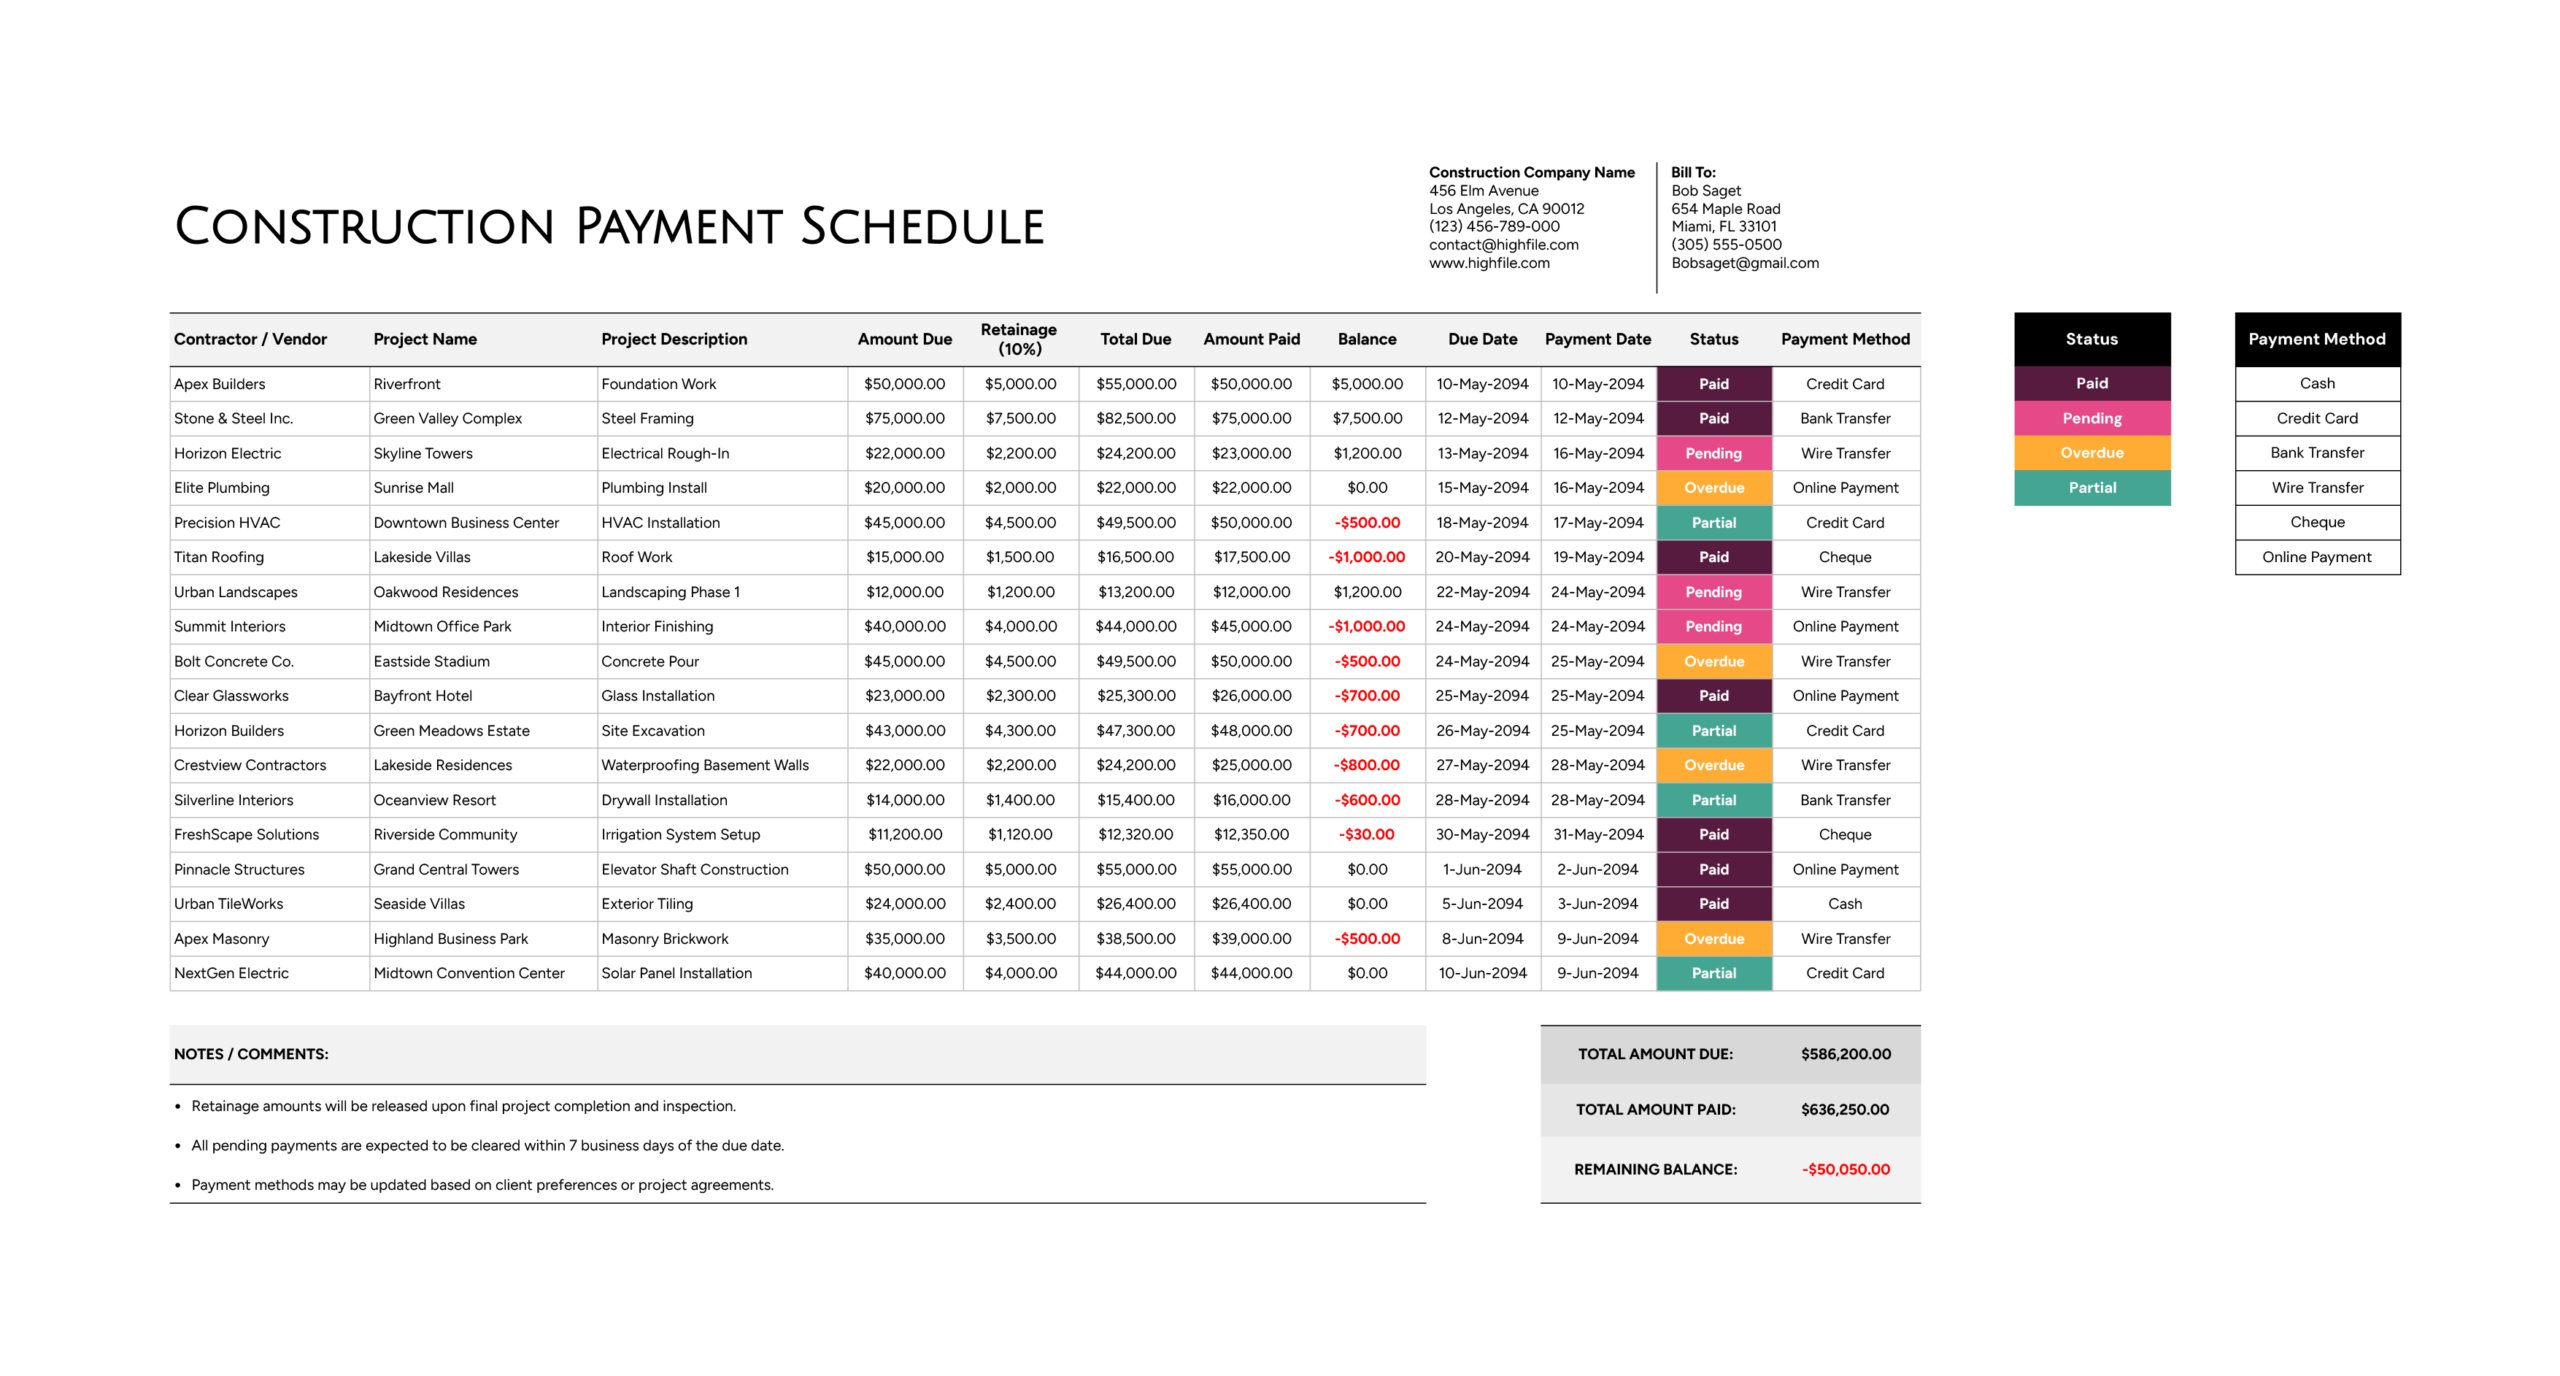
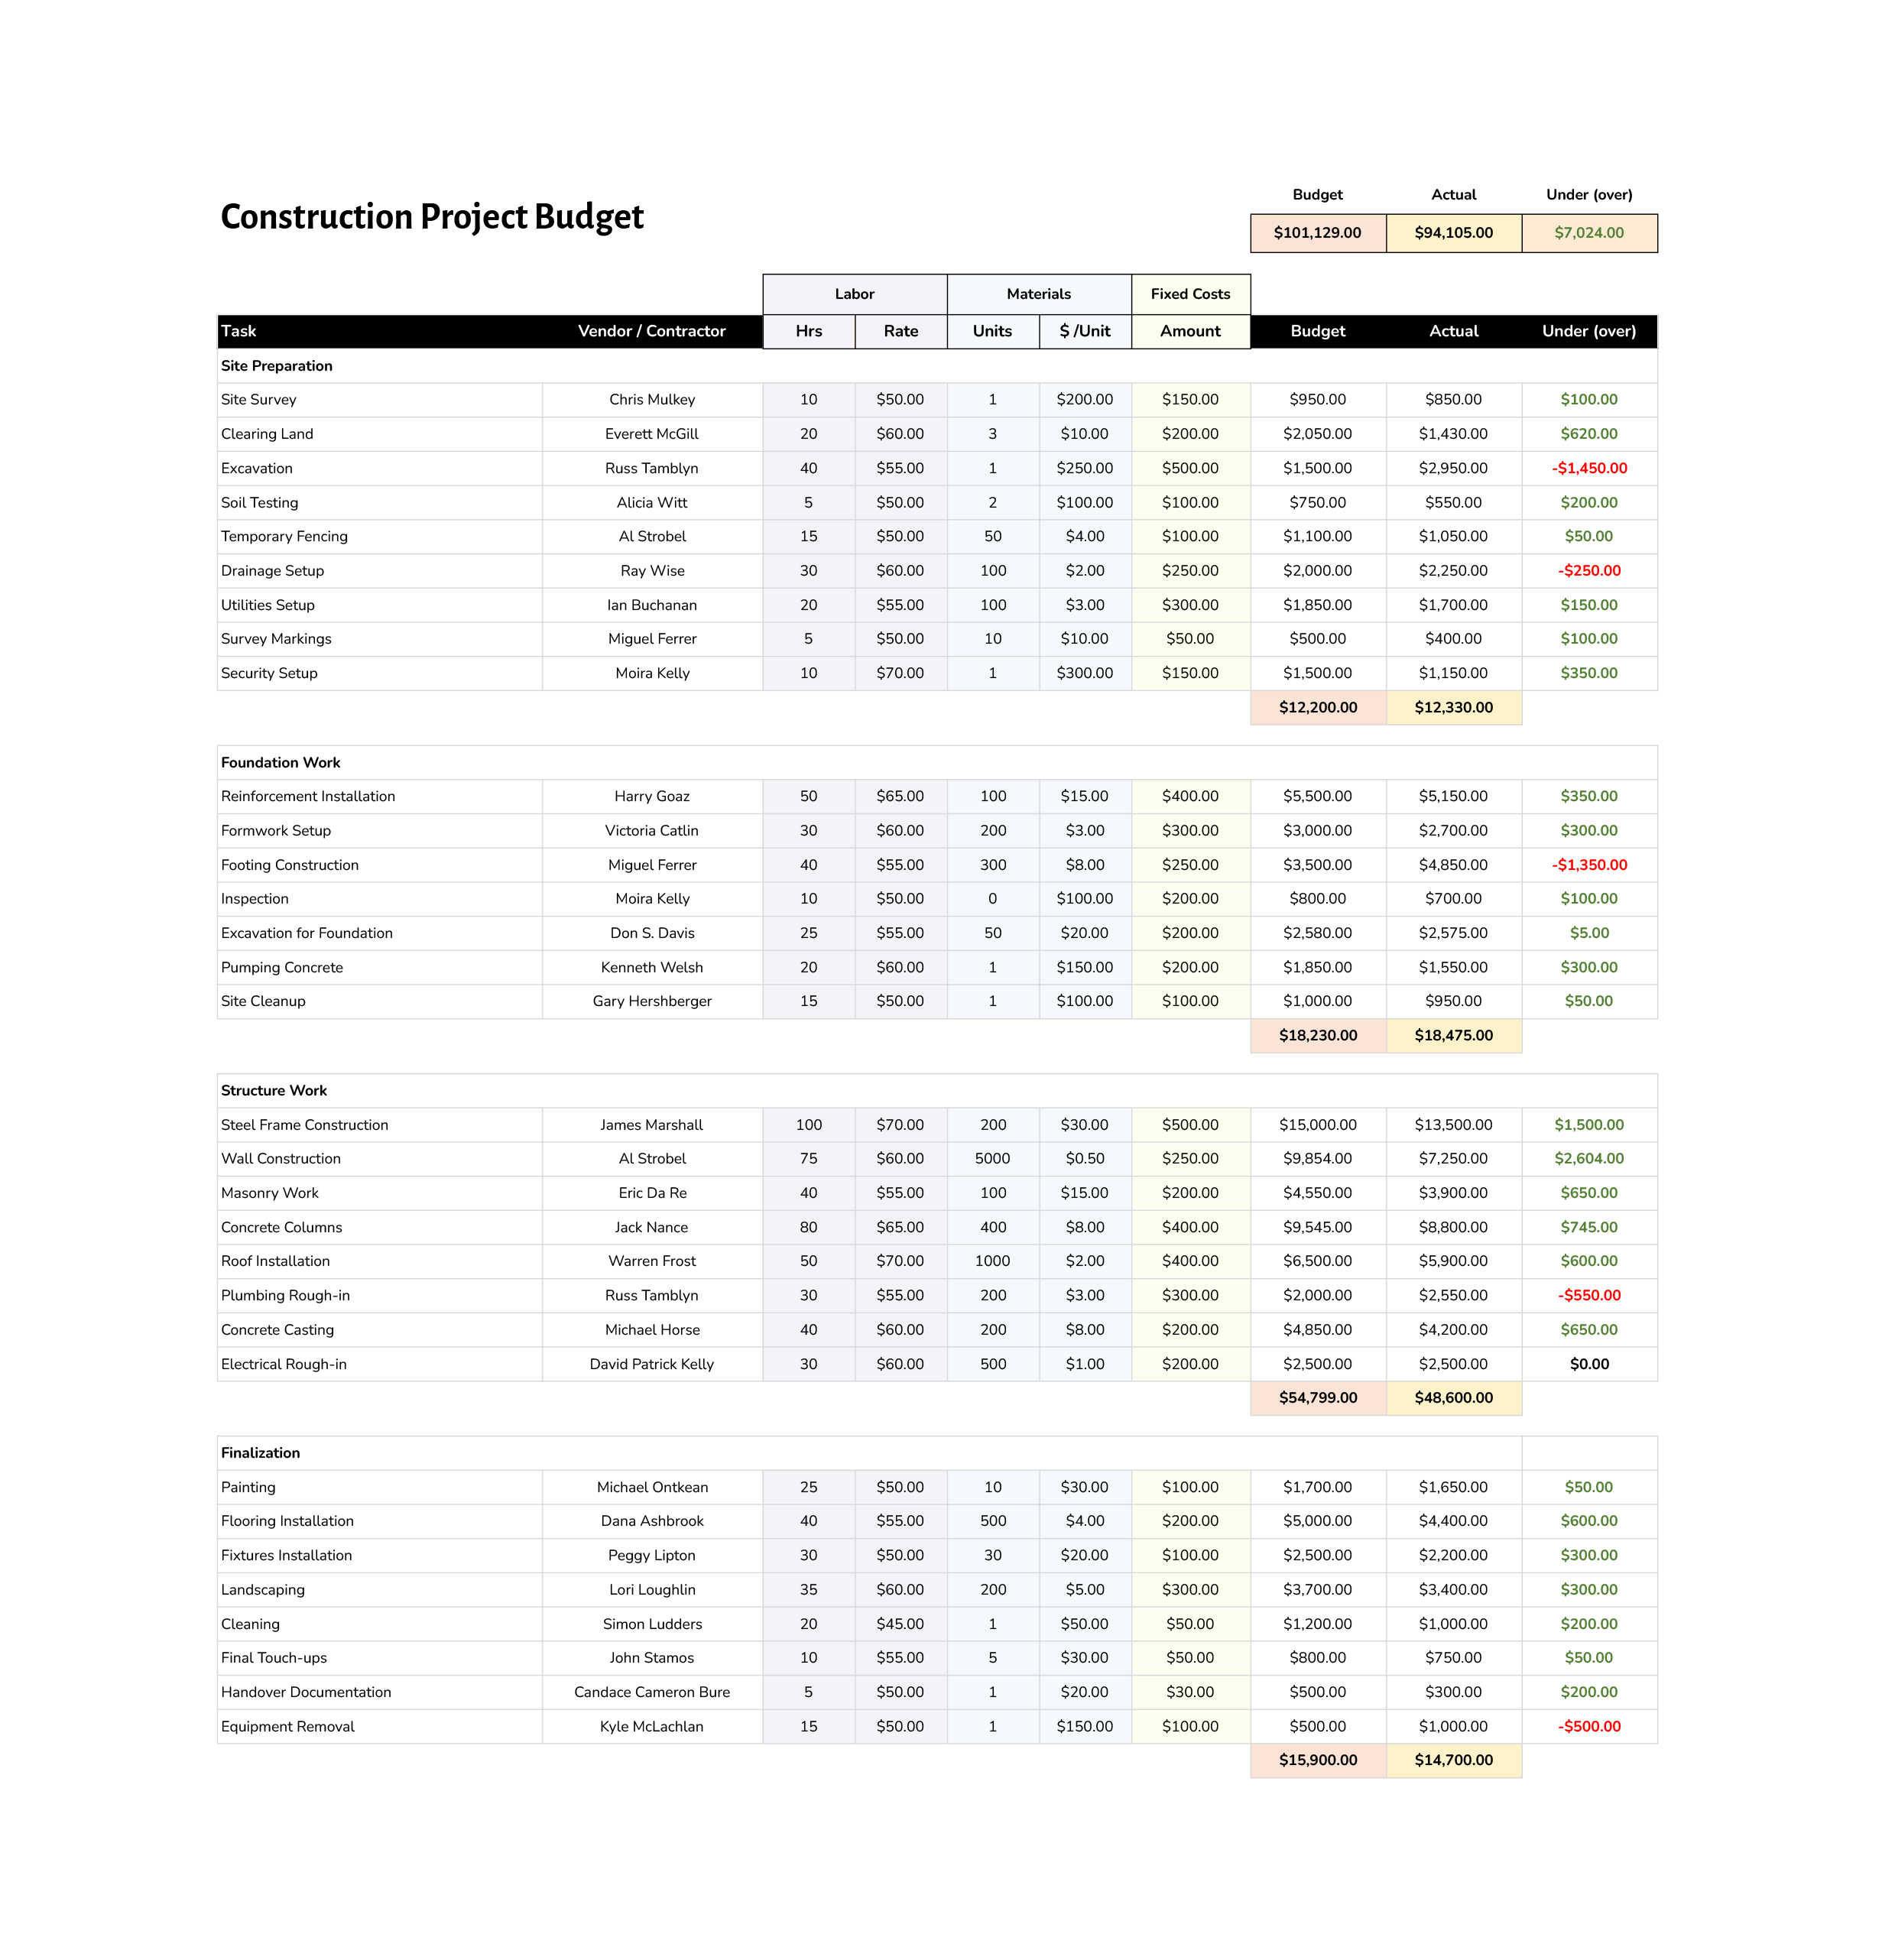
Each task and phase has fields to input estimated and actual costs, giving you a clear comparison between expectations and actual draws, along with the due dates for each payment. The payment status can also be updated in the designated cells, making it easy to manage the flow of funds.
After filling in the relevant information, the template automatically calculates totals for each phase and provides a summary at the top. This overview makes it easy to compare estimated and actual costs, allowing for better planning and financial management.
The template is designed for simplicity while being adaptable to different draw schedules, and is fully functional in both Excel and Google Sheets.