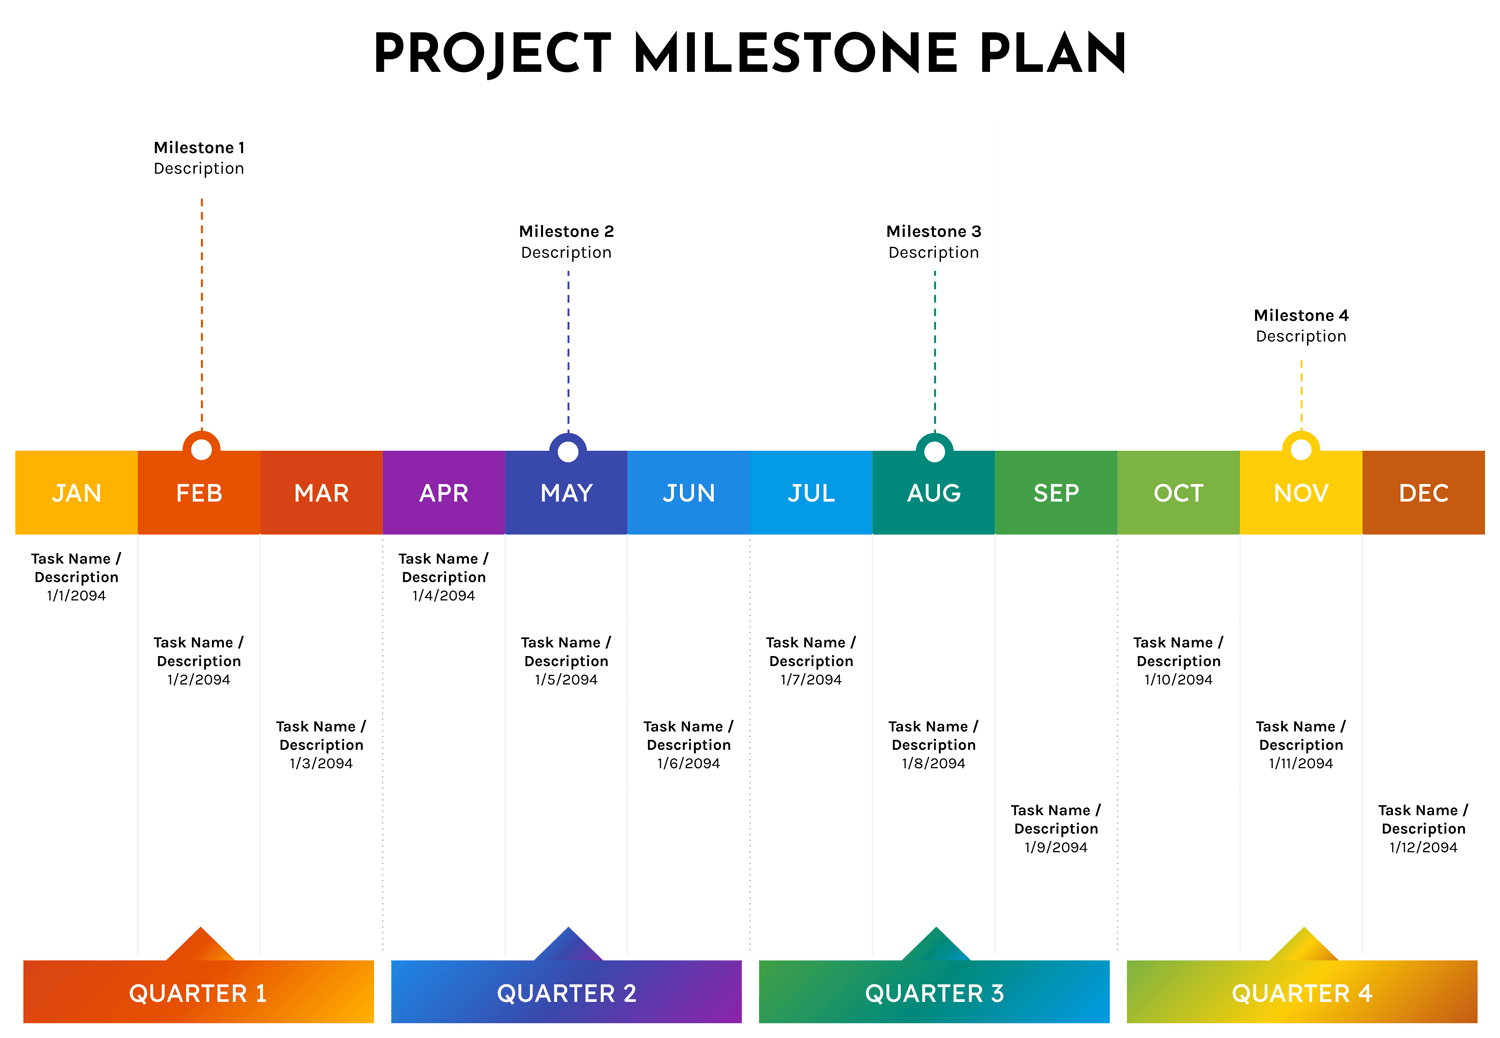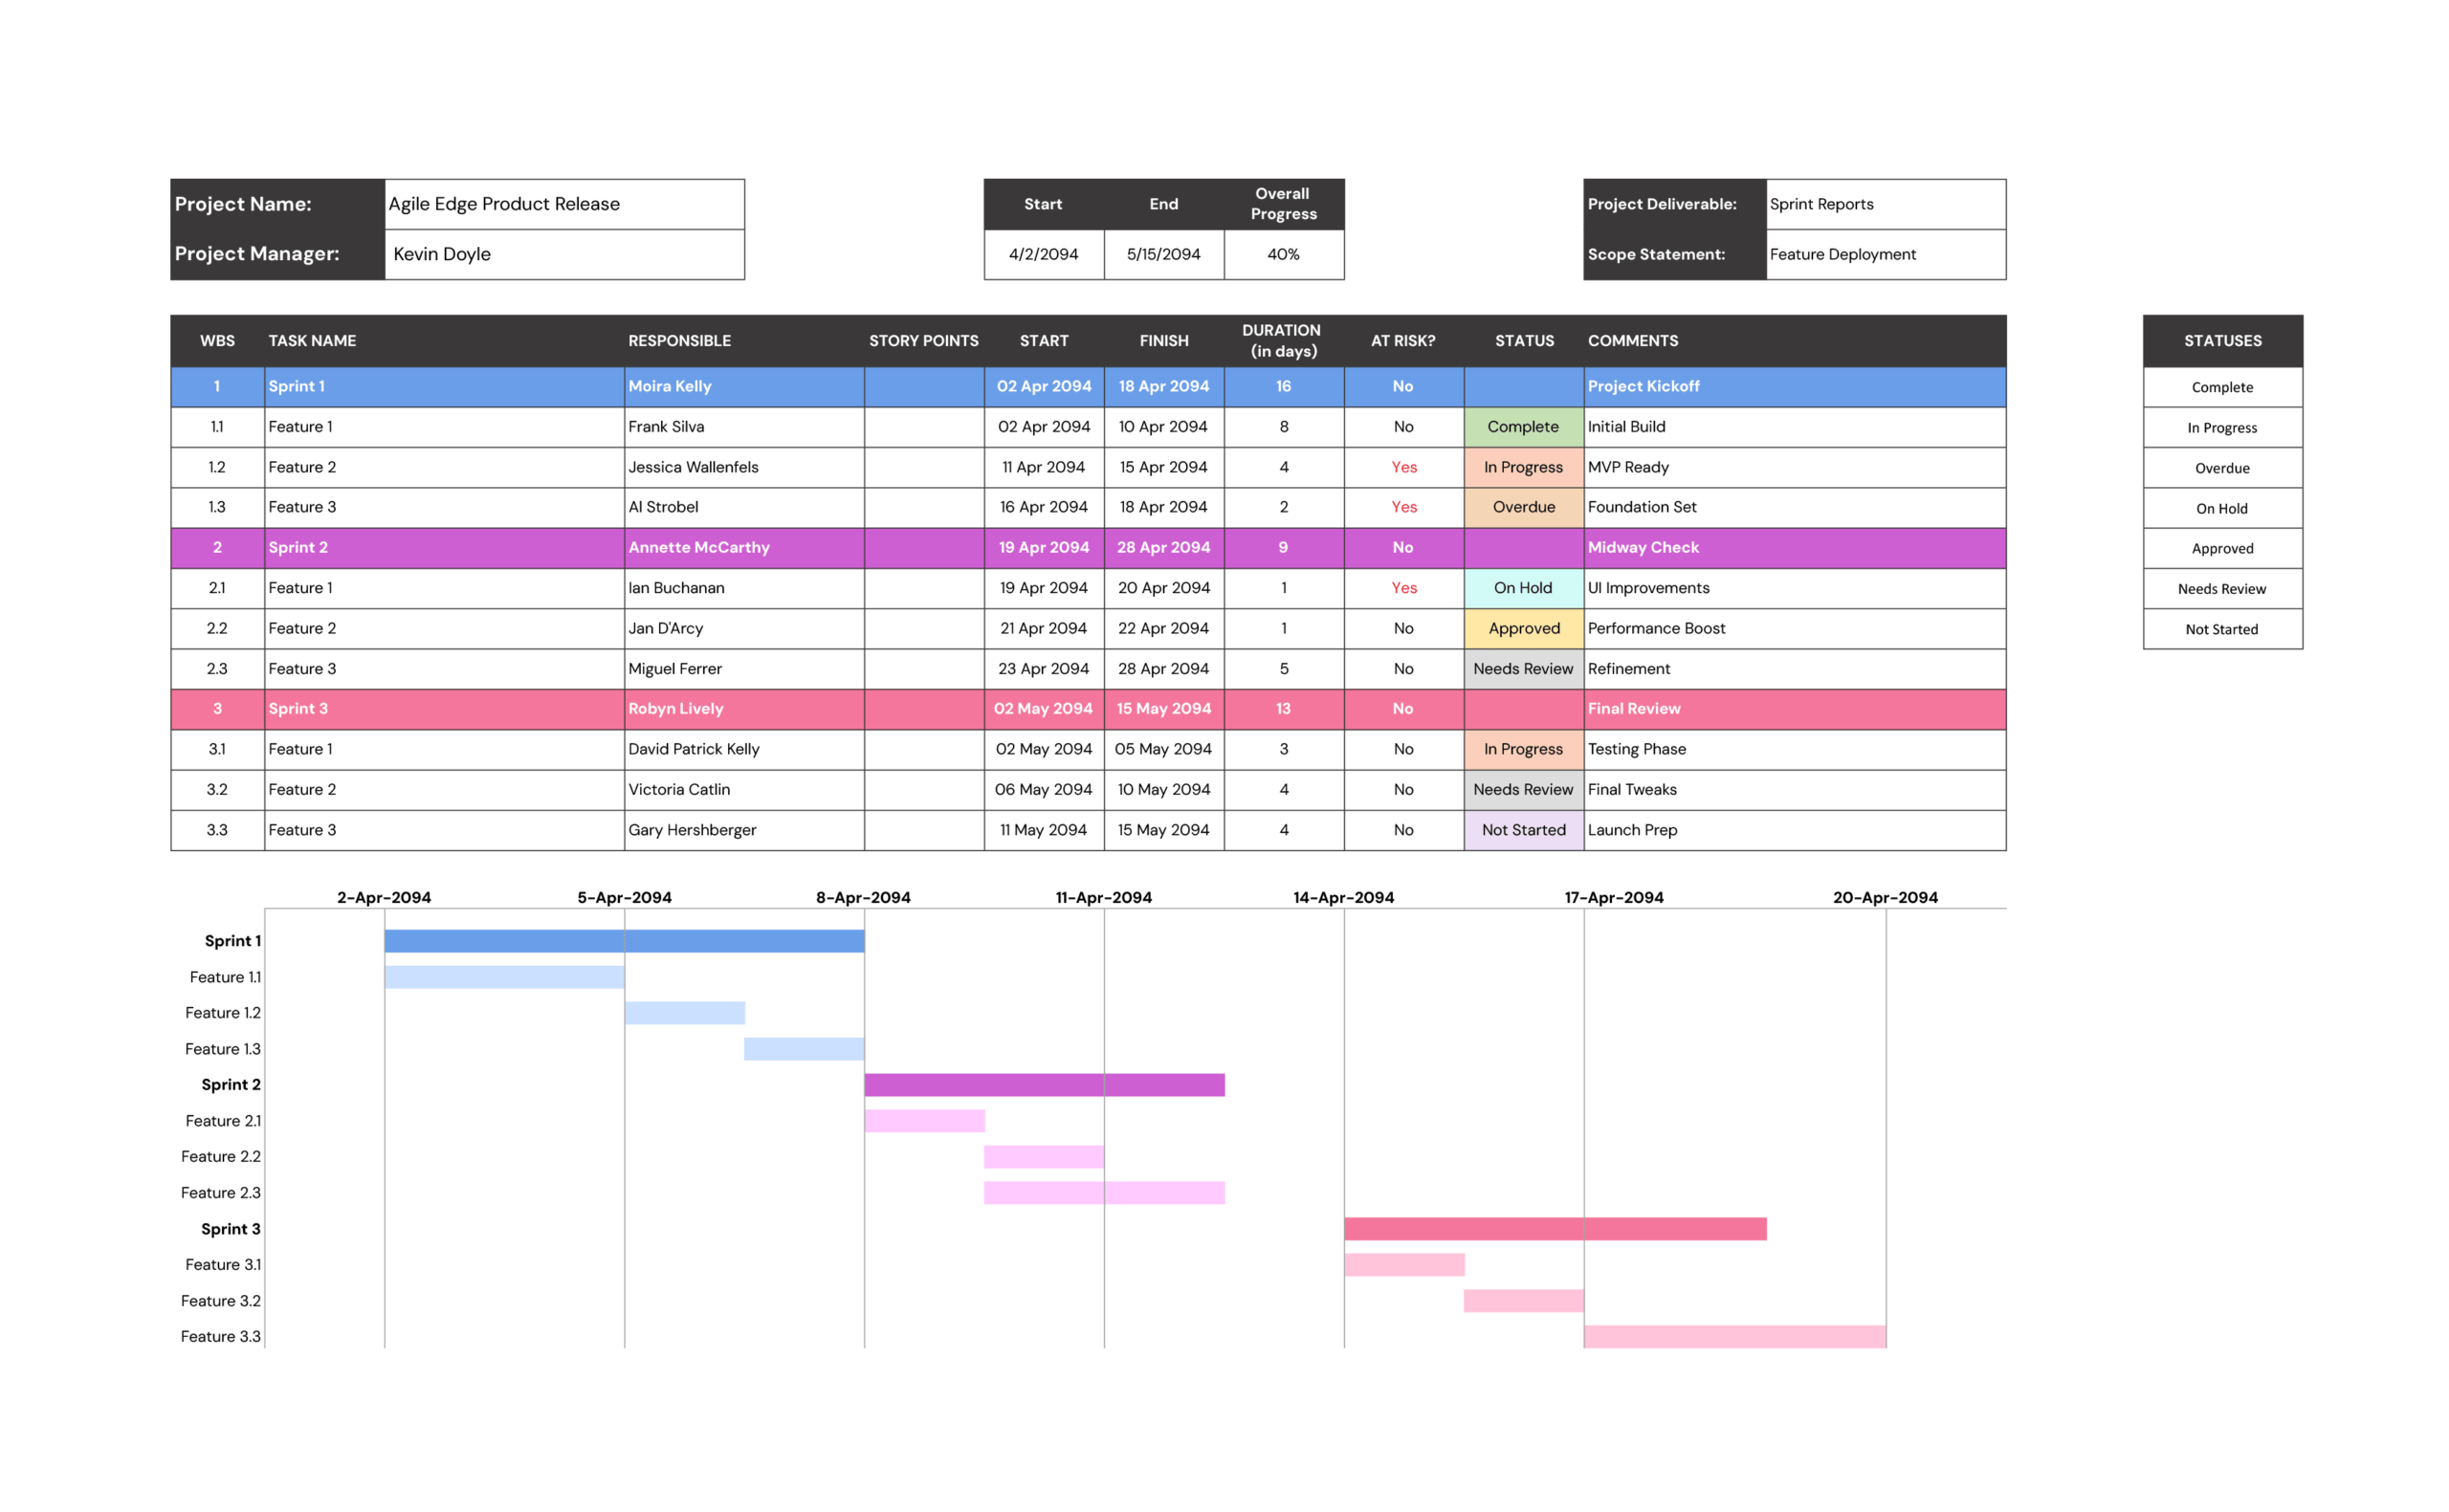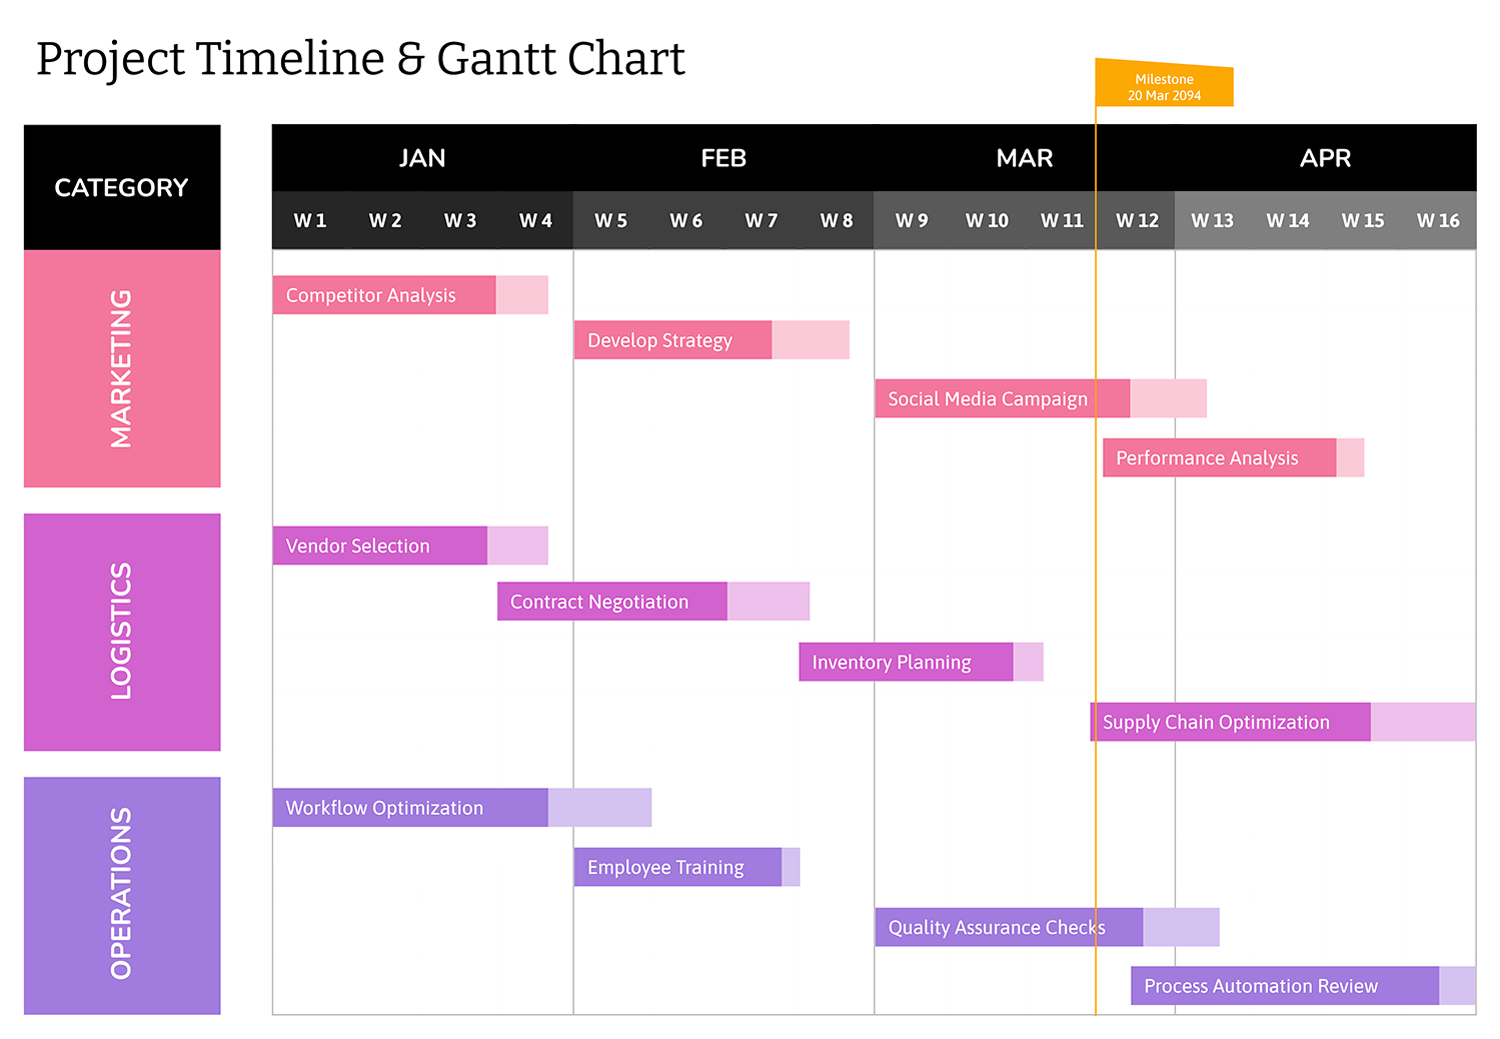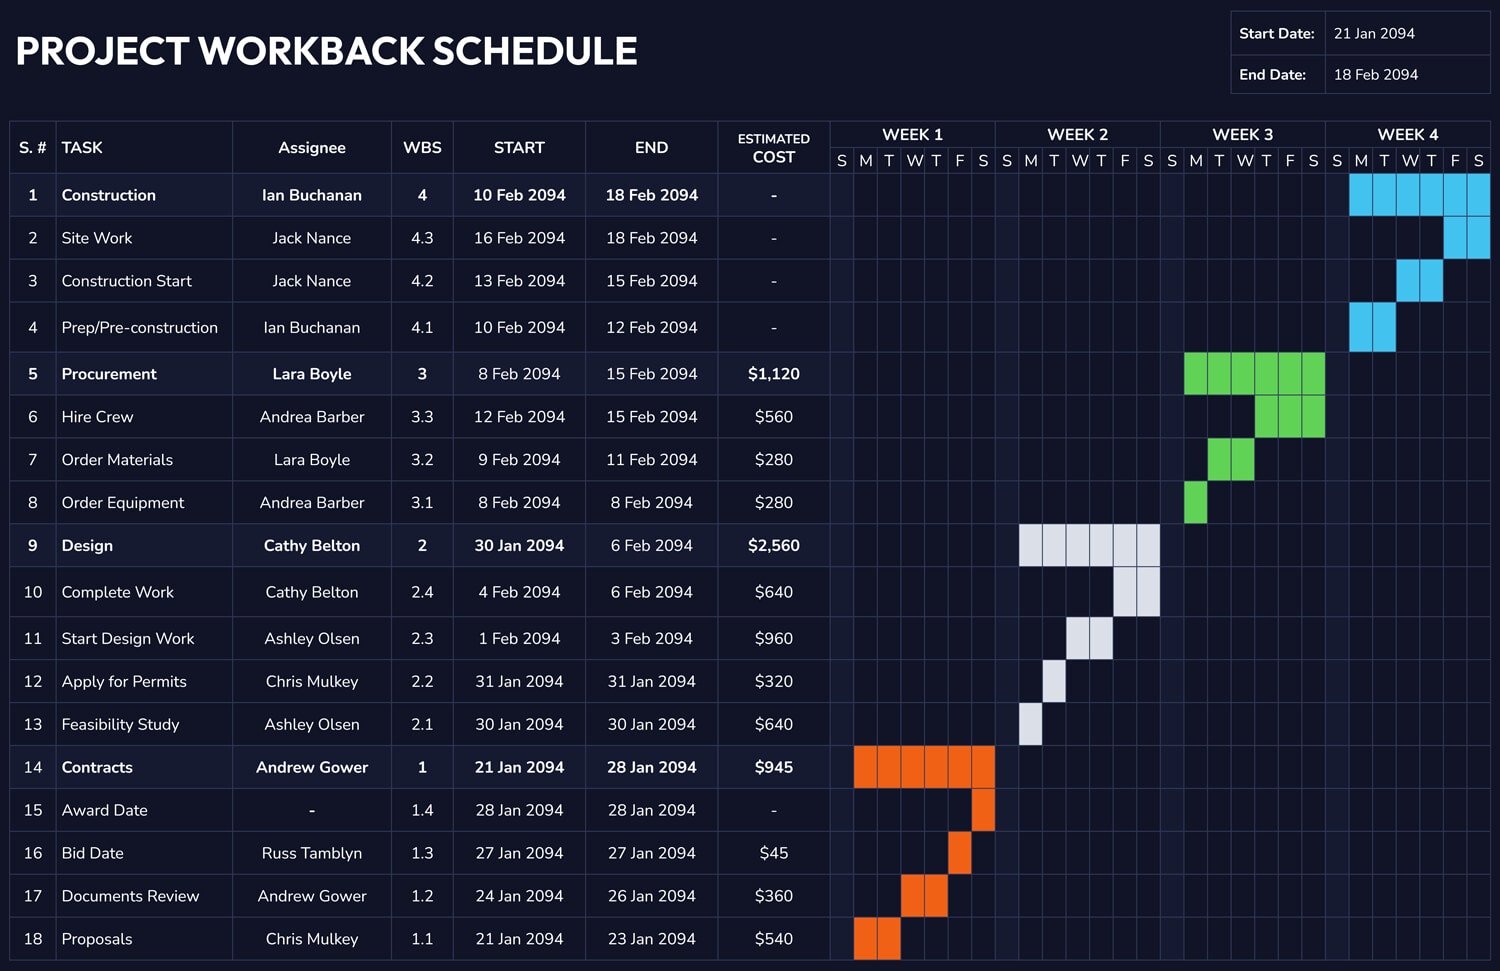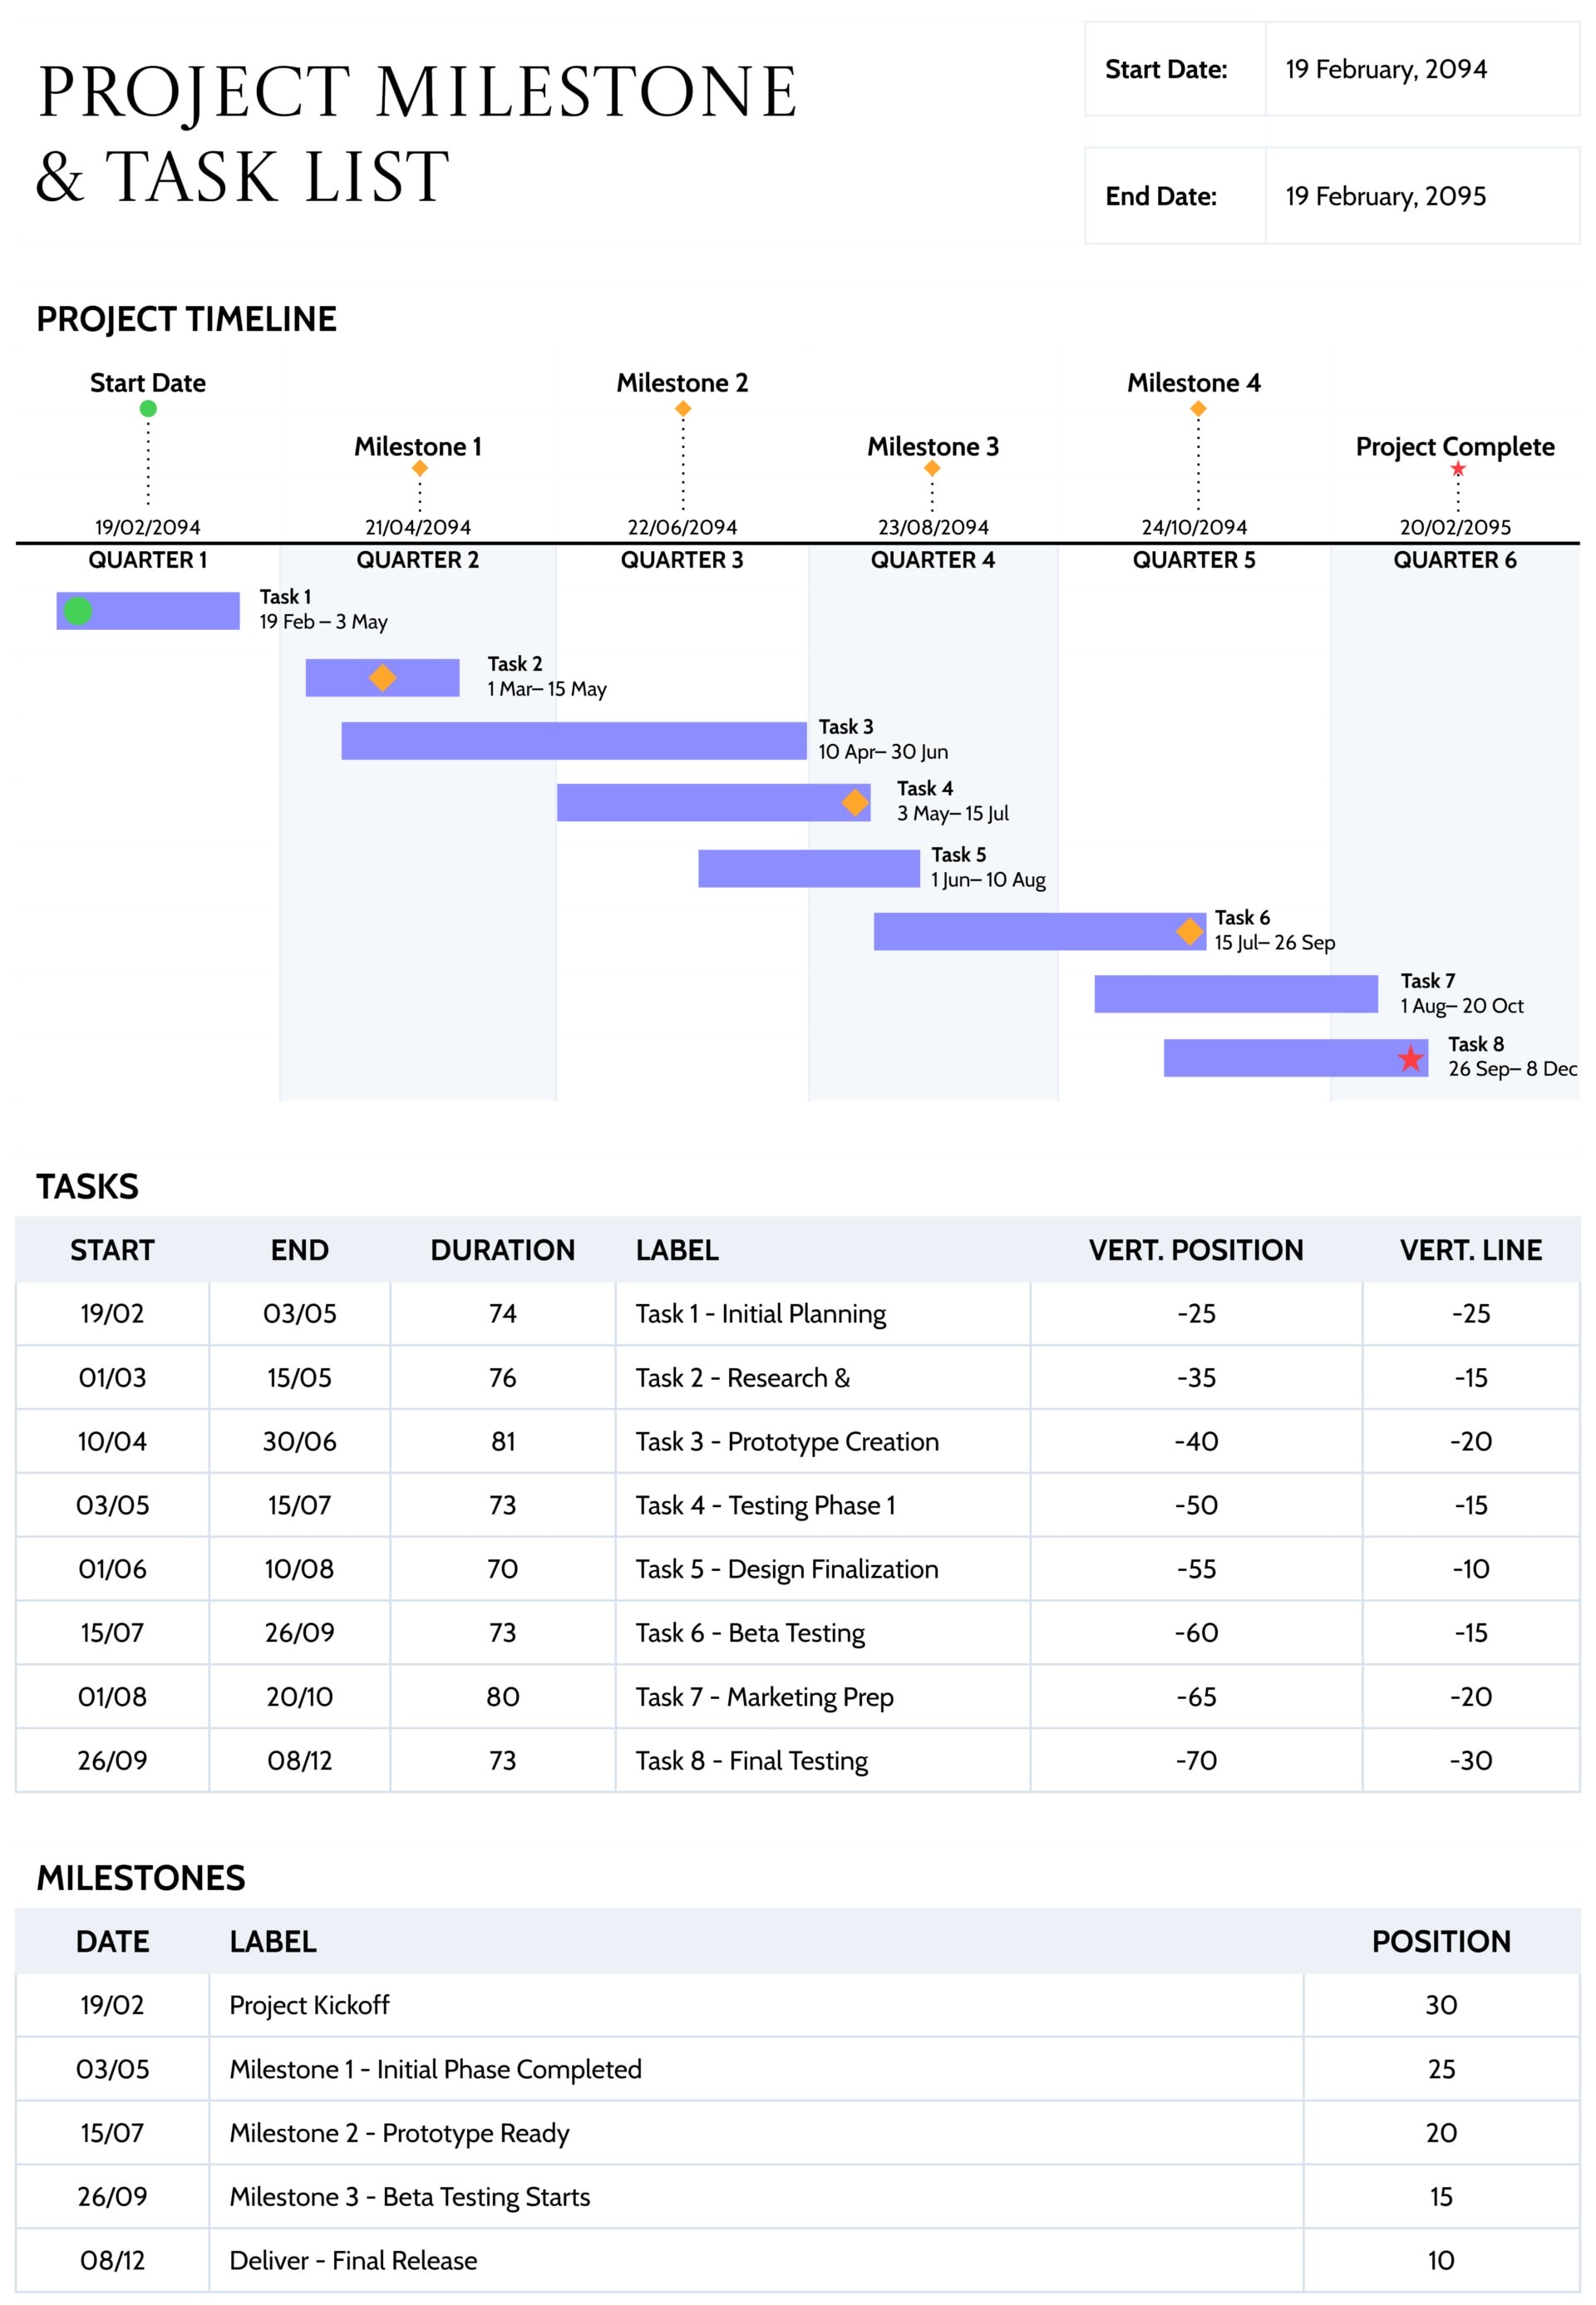


A project timeline chart is used when you need to show how work phases run across a full year and where key dates fall. It gives sponsors, clients, and team members a single view of start dates, end dates, overlaps, and important checkpoints without going into detailed task lists.
This project timeline Gantt chart template is designed for annual roadmaps, long implementation projects, or department plans. You can map high level phases, show which periods of the year are busy, and highlight a small set of critical target dates that matter most to decision makers.
How To Use This Template
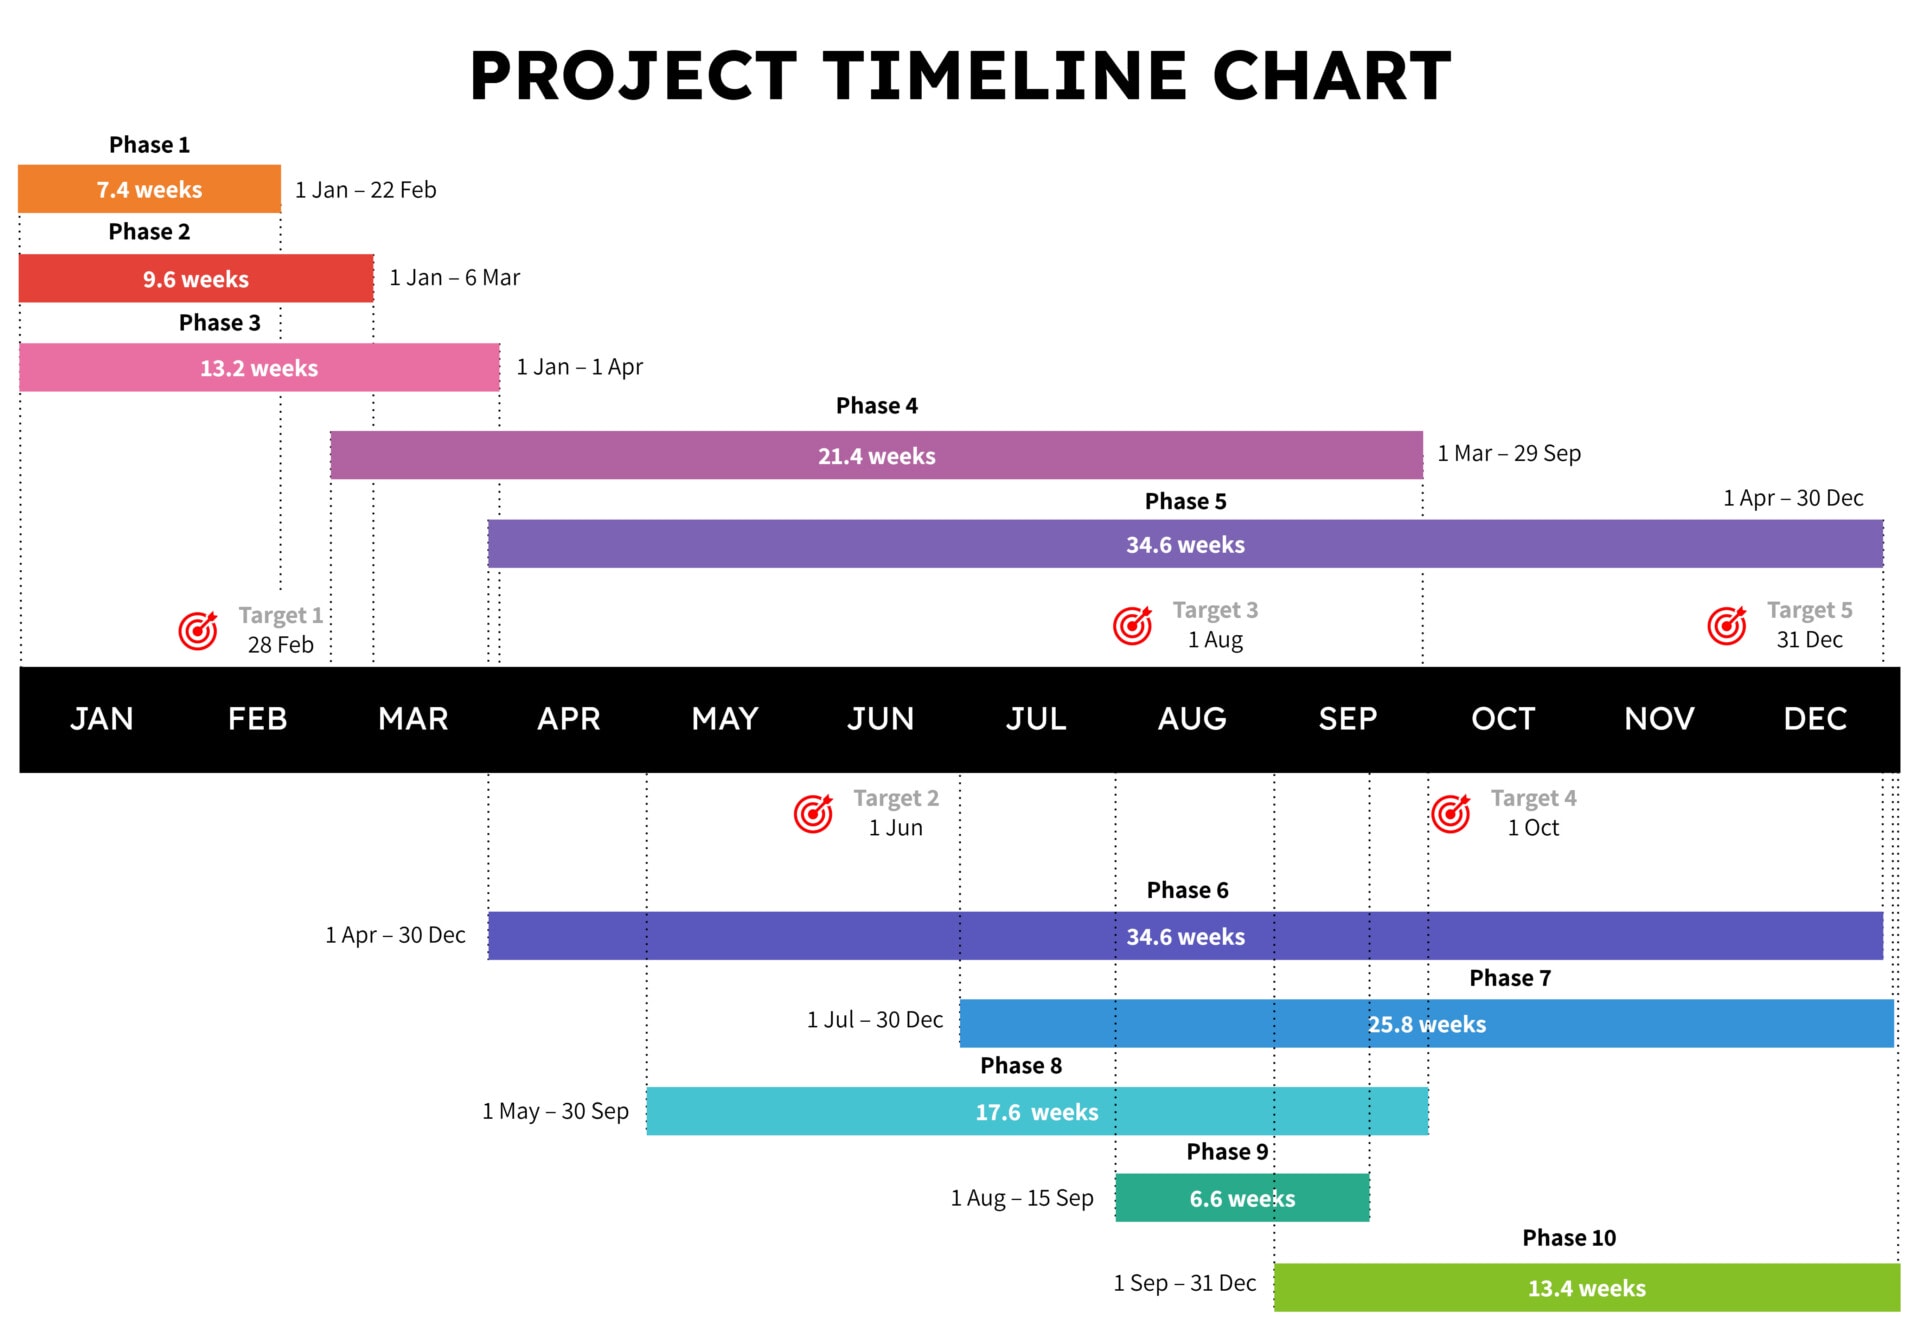
This chart is built as an editable slide. Each horizontal bar is a separate shape with editable text for the phase name, start date, end date, and duration in weeks. The target icons and their labels are also separate objects, so you can reposition them along the timeline and rename them to match your project milestones.
Set Up Your Project Timeline
Begin by deciding the twelve month period you want to display, for example January to December or your fiscal year. Rename each bar with your own phase titles such as Discovery, Planning, Build, Testing, Rollout, or Support.
Update the start and end dates on each bar so they align with the month scale along the bottom. Adjust the duration in weeks so it matches the dates you entered. If some phases run in parallel, keep their bars on different rows. Viewers can then see at a glance which workstreams overlap and how long each one continues.
Use longer bars for ongoing activities that span many months, such as development or operations. Use shorter bars for focused items near launch such as cutover, training, campaign activity, or project closure. This keeps the chart readable and emphasizes the work that defines each part of the year.
Add Milestones and Targets
Next, review which dates in your project are truly pivotal. These might include contract signing, design sign off, beta release, regional launches, regulatory deadlines, or final go live. Rename the target labels with these events and move each icon so it sits under the appropriate month on the chart.
You can use the targets to show which phases must finish before a key decision or release. When a stakeholder looks at the slide, they can associate each target date with the surrounding phases and immediately see whether enough time has been allocated between milestones.
Use the Chart in Meetings and Reports
Once your phases and targets are in place, reuse this slide in project kick offs, steering committee meetings, and routine status updates. It works well in screen shared presentations and as an attachment in email summaries because the entire plan appears in one view.
For regular reporting, you can keep the overall layout the same but adjust bar colors or add subtle annotations to show which phases are in progress, delayed, or completed. This turns the chart into a living summary of the project rather than a one time planning visual.
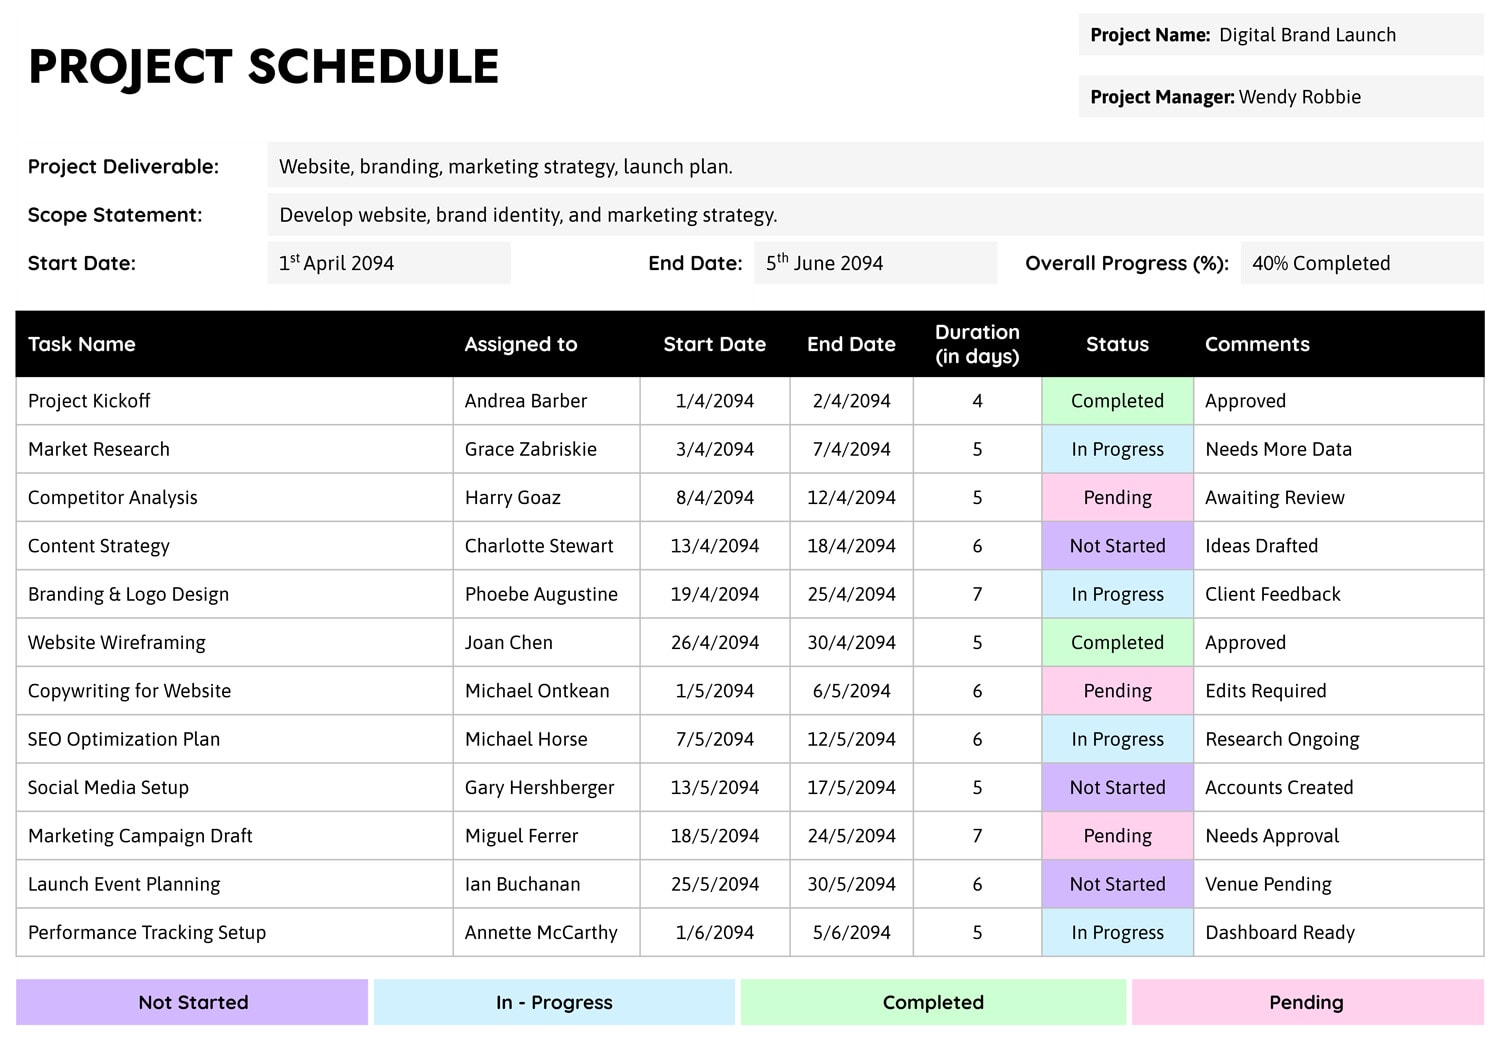
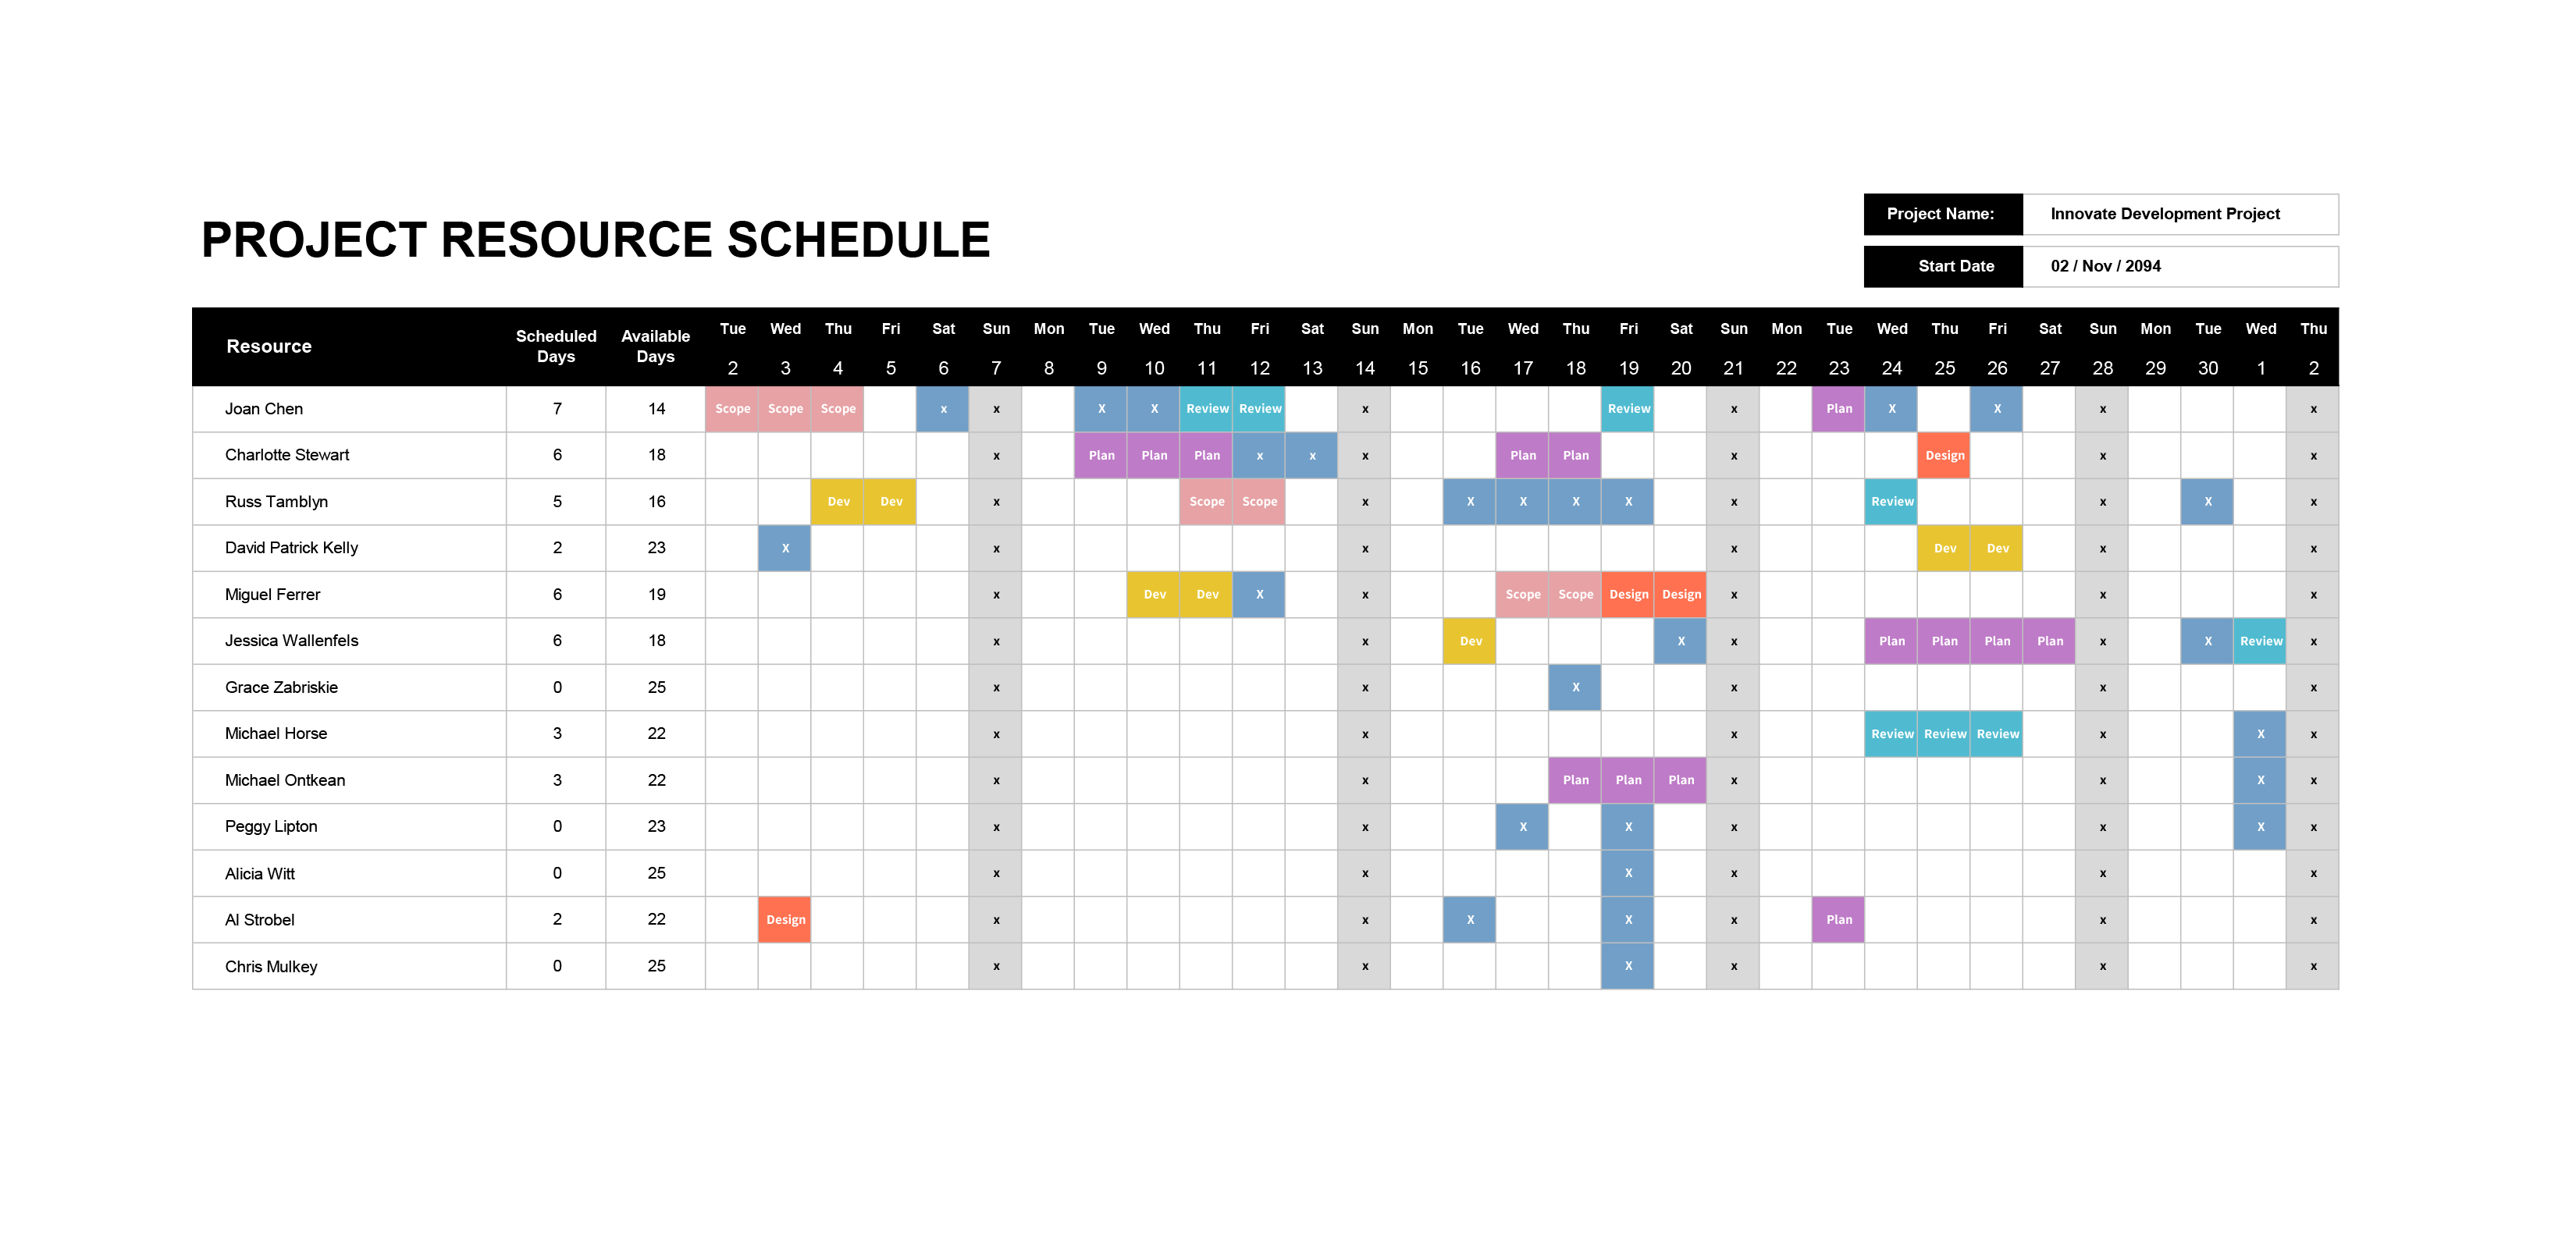
Keep the number of phases on this chart limited to the major workstreams. Use this timeline schedule template for the high level picture and keep detailed tasks, dependencies, and resource assignments in a separate project schedule or task management system.