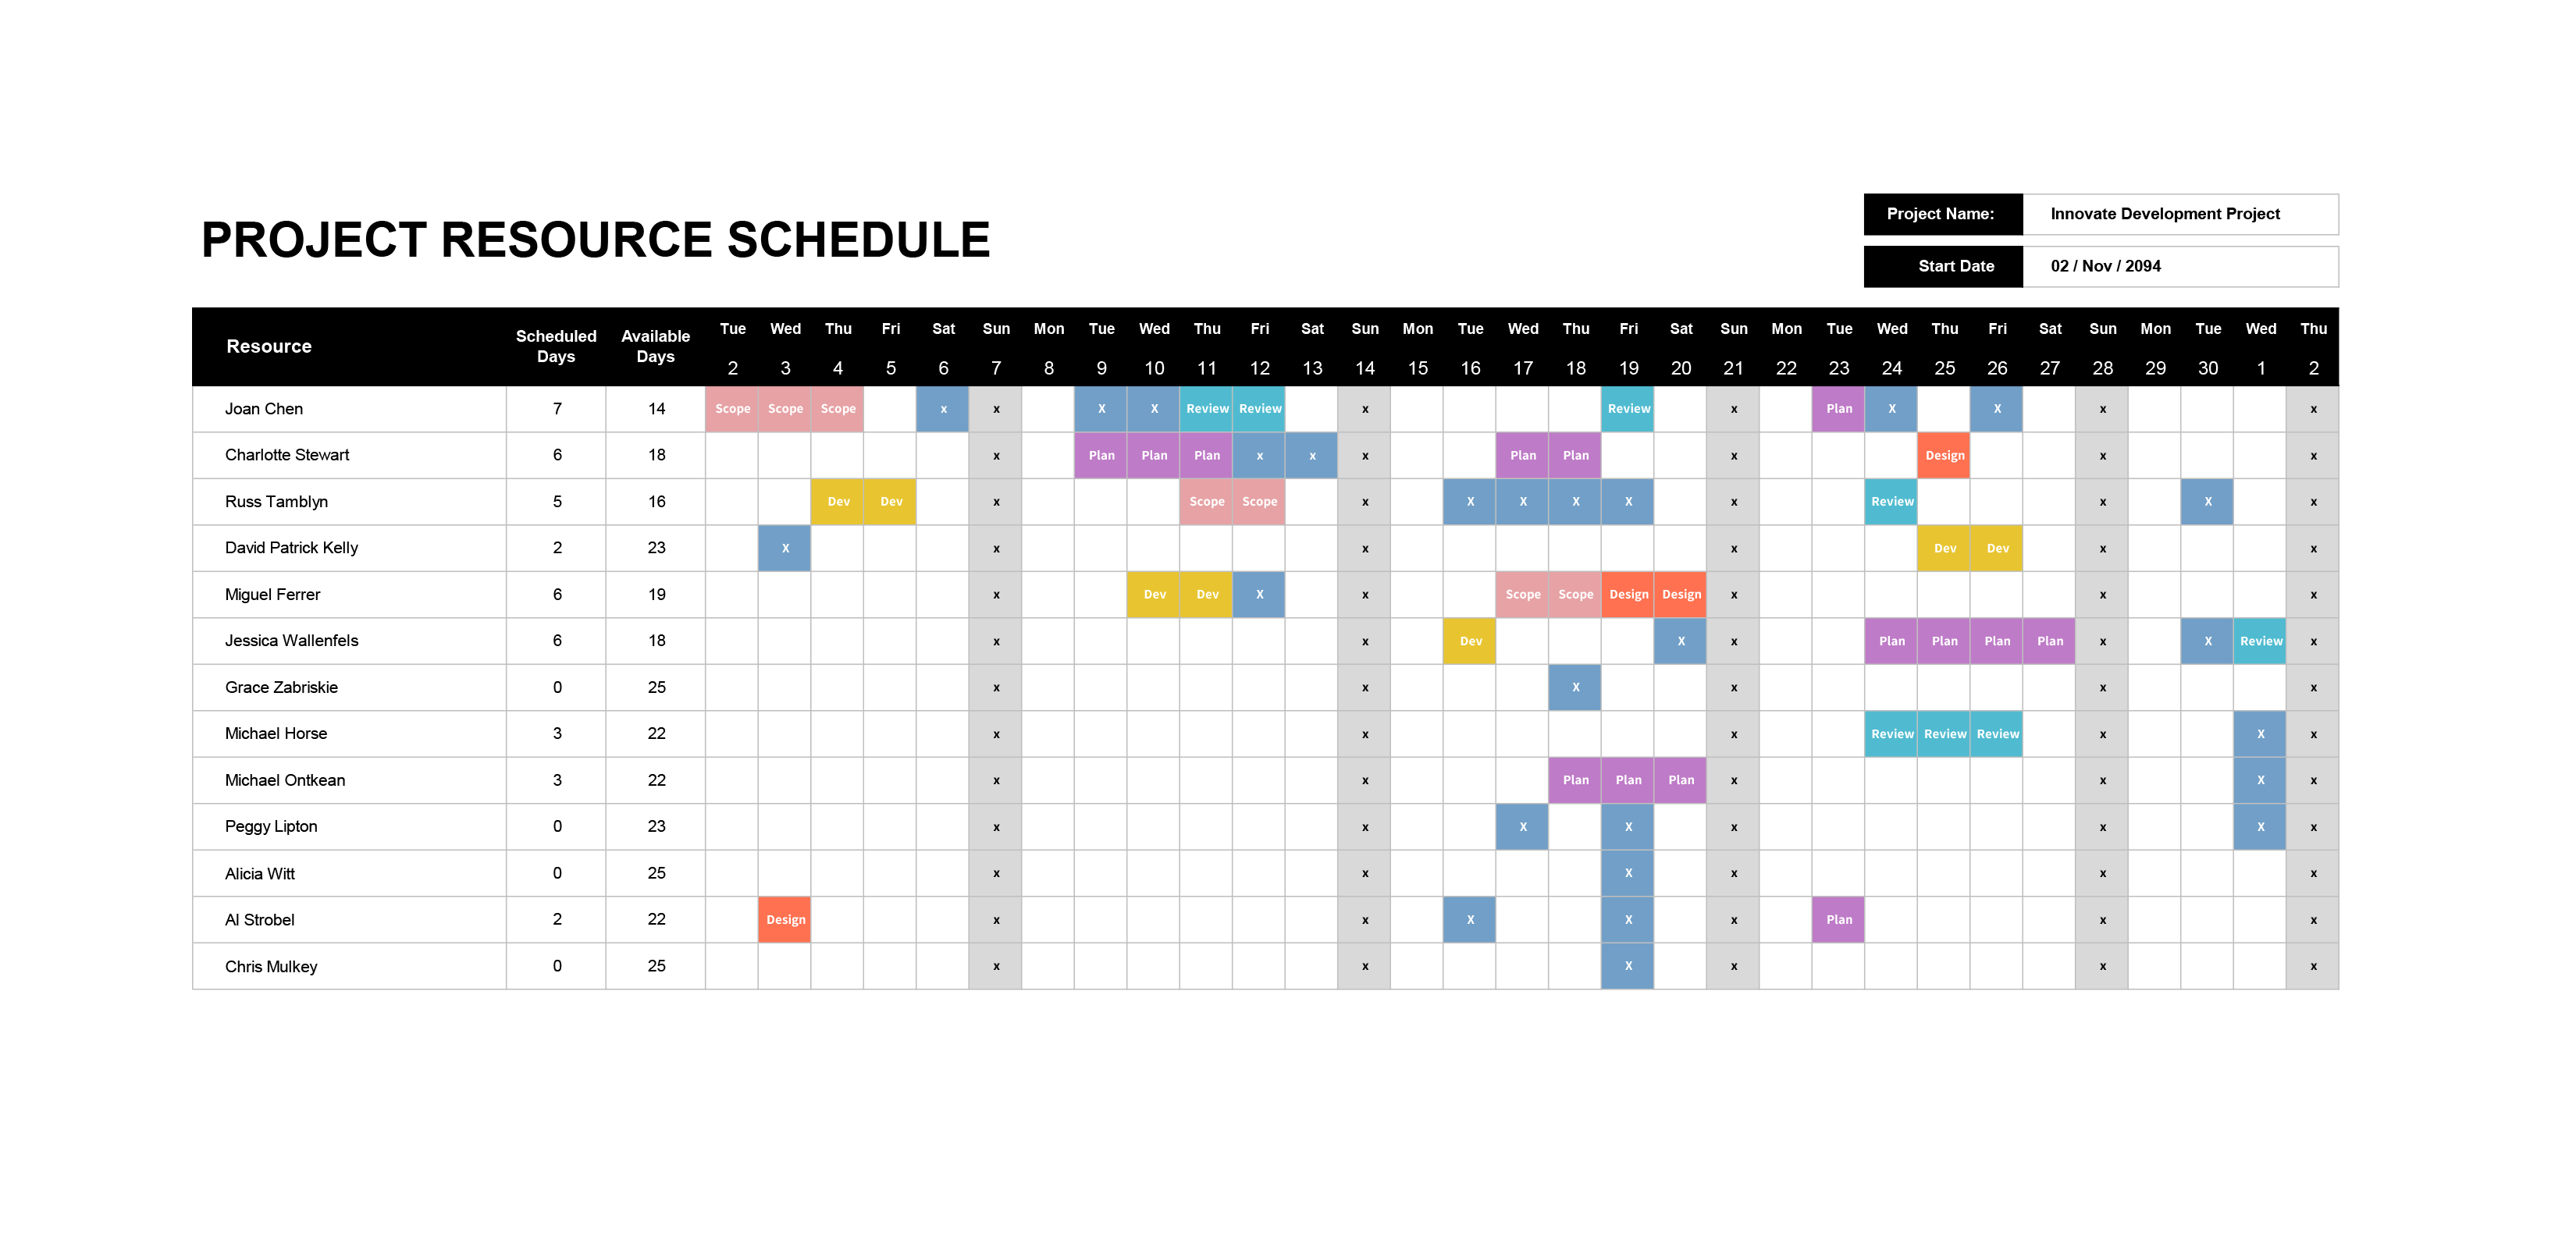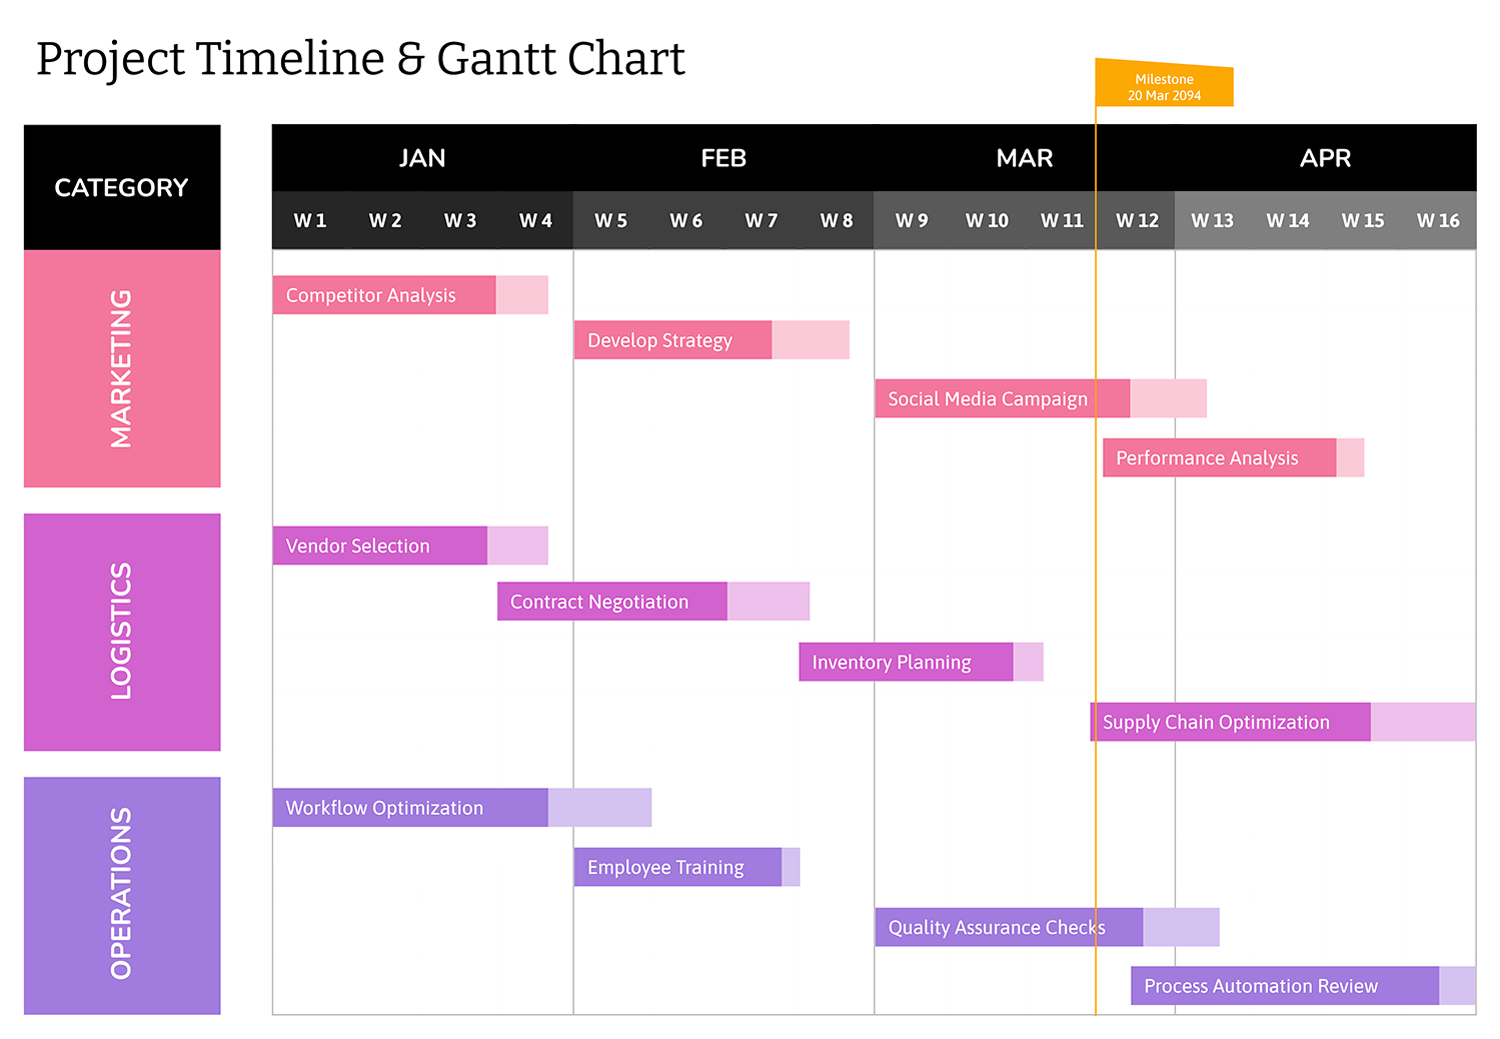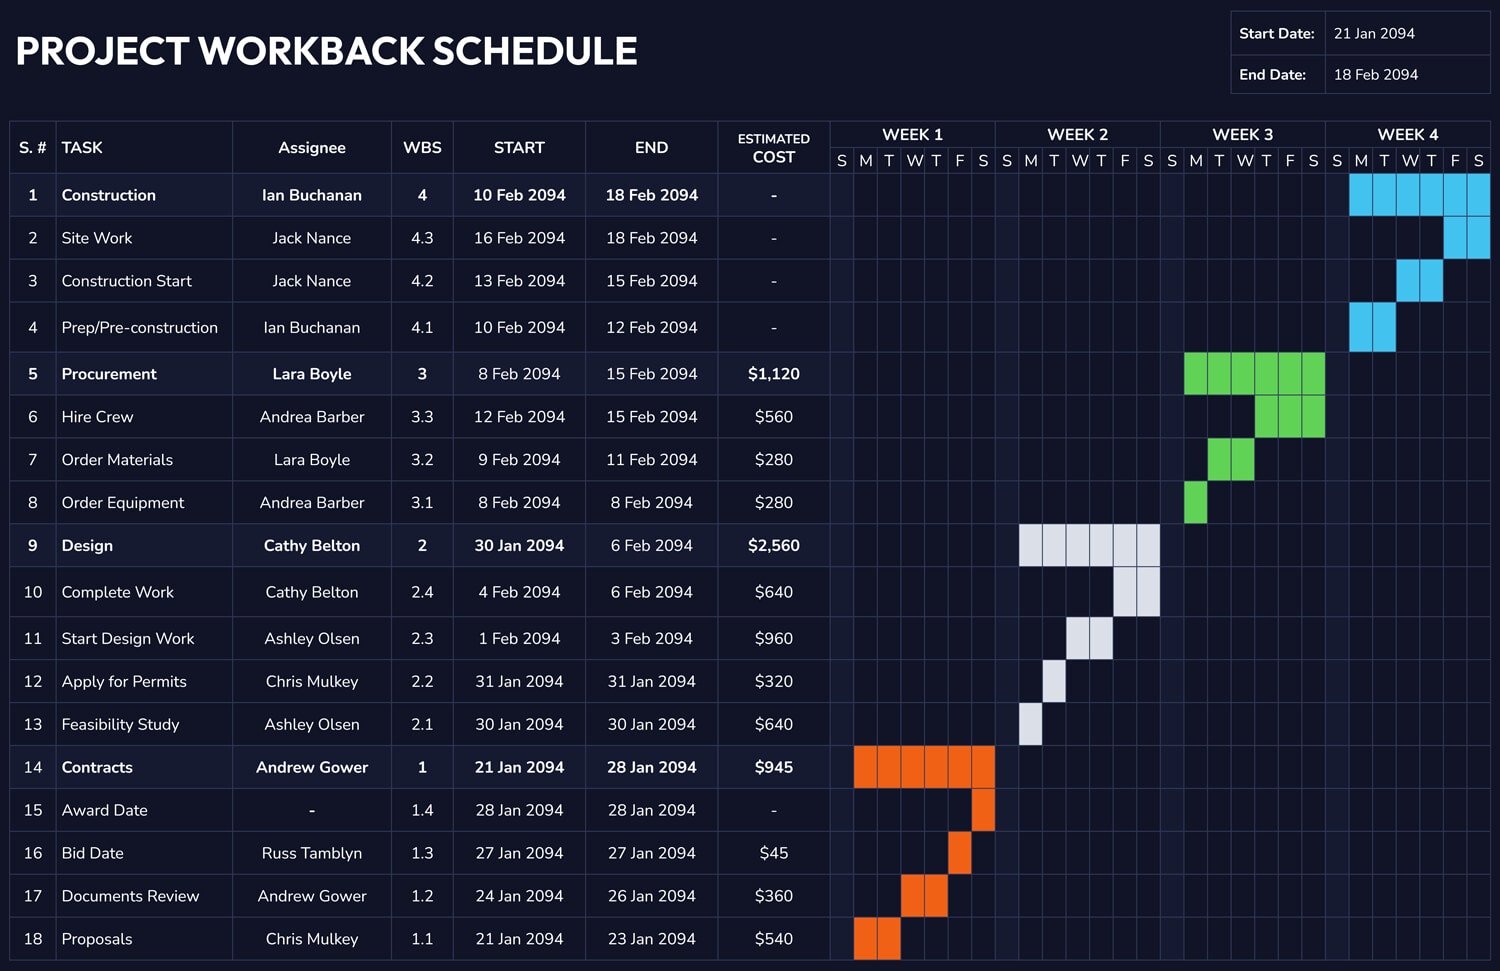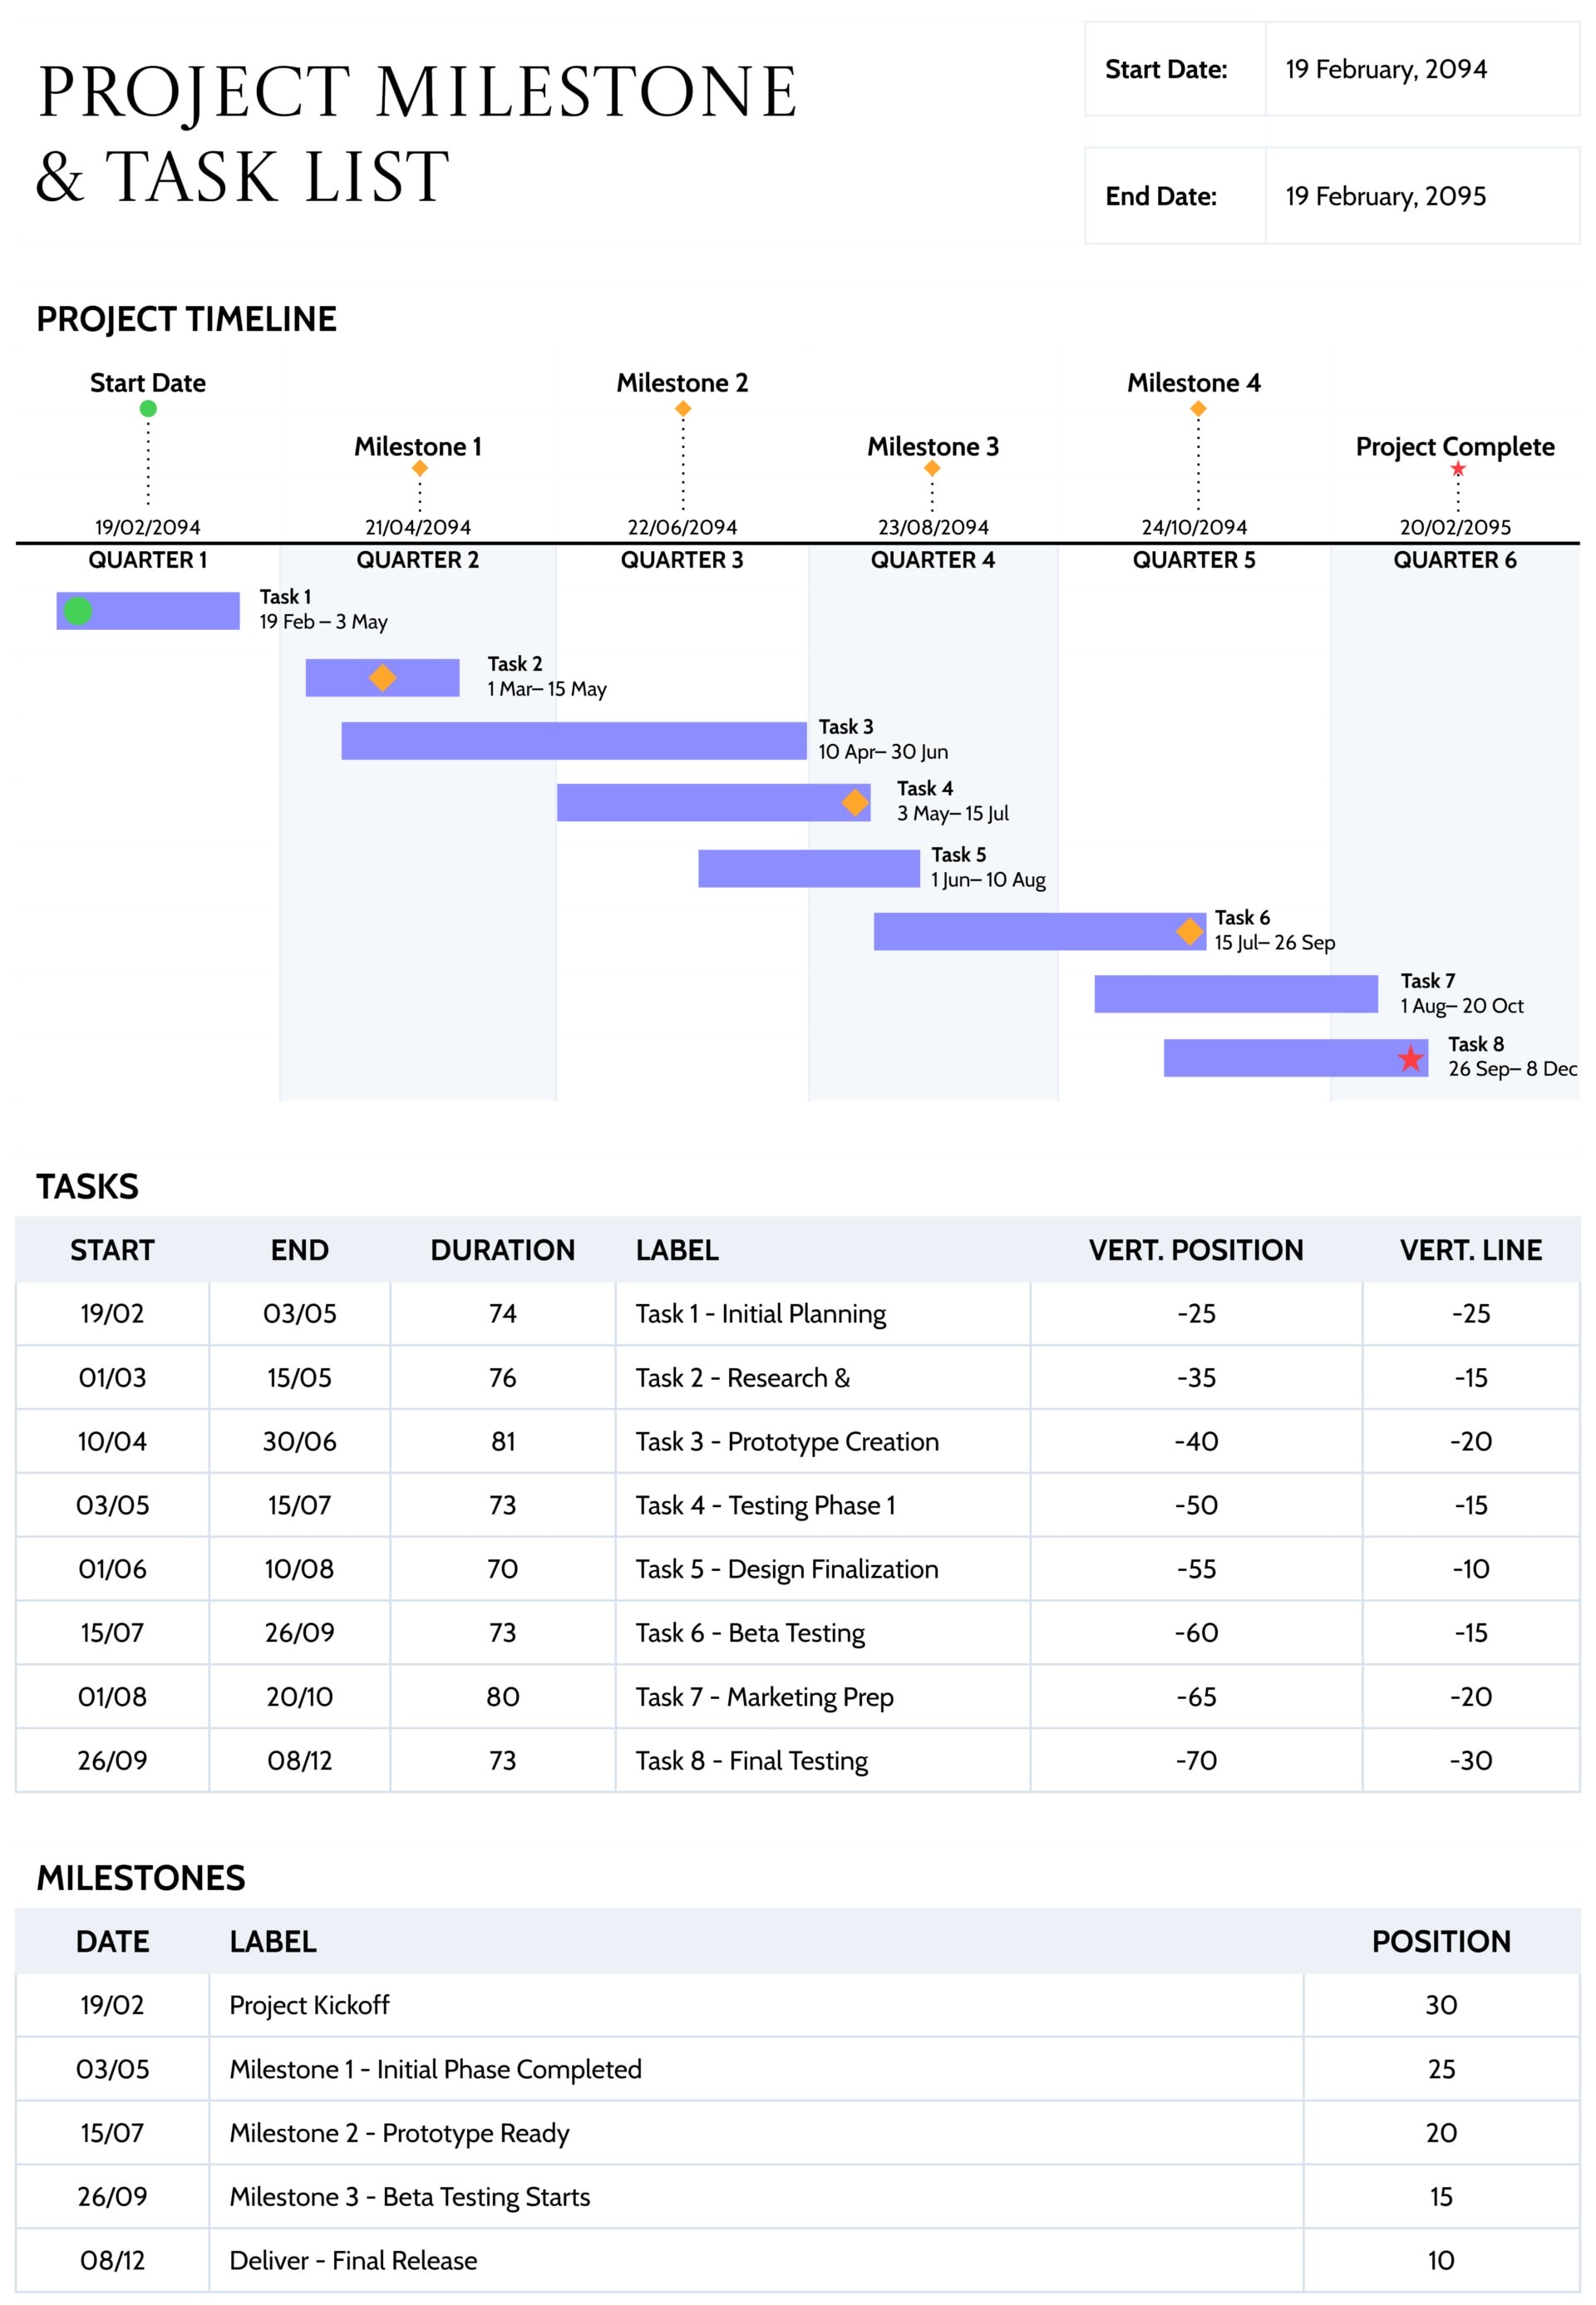

The agile project schedule template is designed for scrum and hybrid teams that want a simple way to plan sprints, assign work, and see the timeline on one page. It works well for product releases, feature drops, or short implementation projects where you need both a sprint backlog and a visual schedule for stakeholders who are more used to dates than boards.
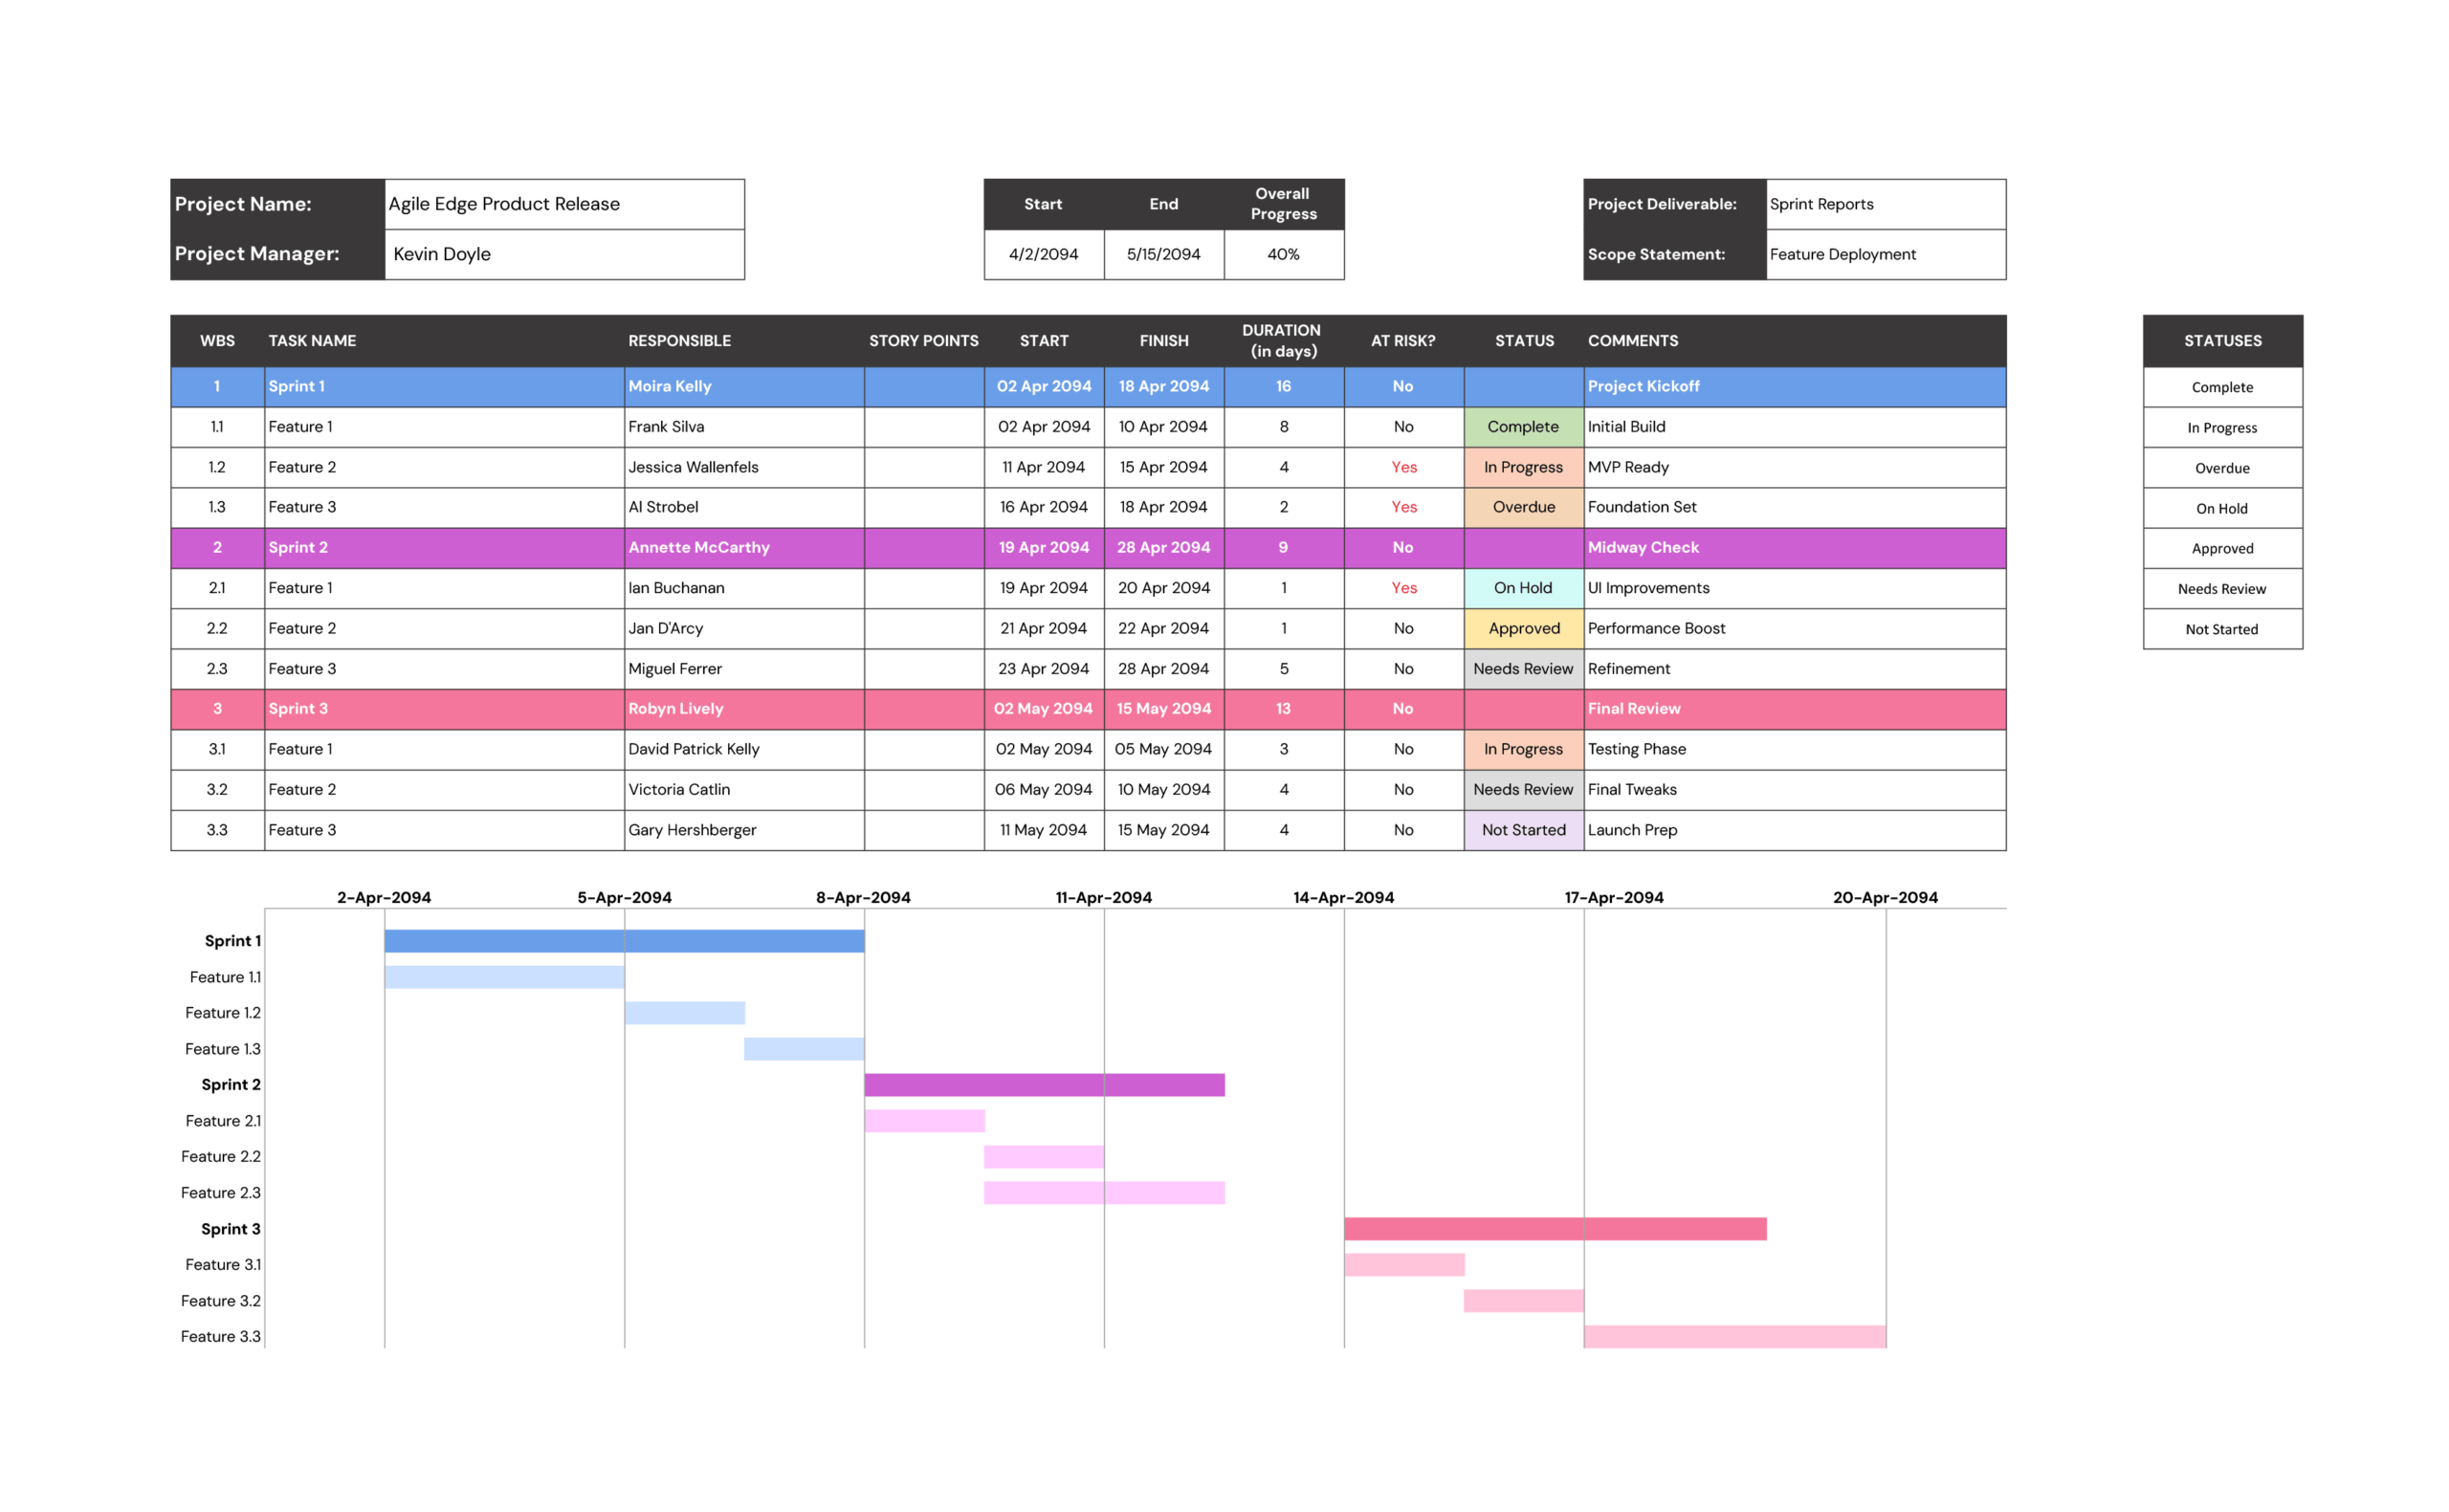
You can use it to organise work into sprints, track story points, record start and finish dates, flag at-risk items, and keep an eye on overall progress. The lower half of the sheet displays the same sprints and features on a Gantt-style chart, so sprint planning discussions and status reviews can happen from the same file.
How To Use This Agile Project Schedule Template
The project schedule template combines a sprint backlog table with a linked schedule chart. You first define sprints and backlog items in the table, then adjust the bars on the chart to match the dates you have entered.
Step 1. Enter Project Summary
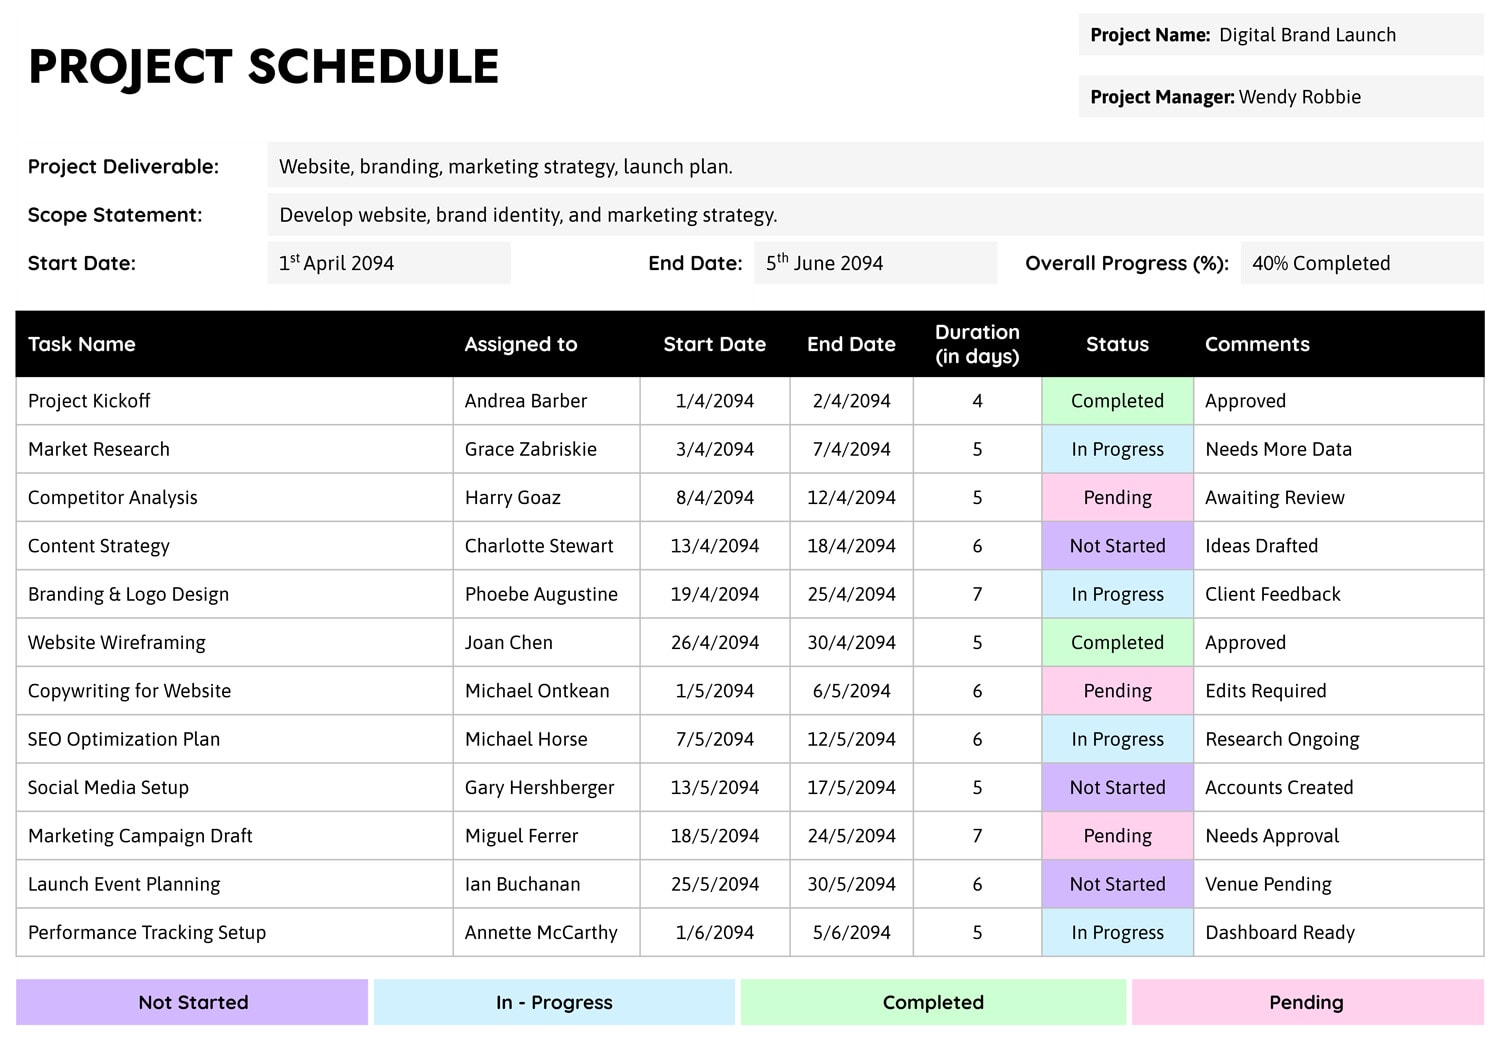
At the top left, add the “Project Name” and “Project Manager”. On the right, record the main “Project Deliverable” (for example “Sprint Reports” or “Release 1.0”) and a short “Scope Statement”.
Complete the small panel in the centre with the “Start” and “End” dates for the overall project window. As work progresses, update “Overall Progress” with the percentage you estimate is complete across all sprints. This can be a rough, communication-friendly number rather than a precise calculation.
Step 2. Define Sprints and WBS Codes
Use the “WBS” and “Task Name” columns to lay out your sprints and features. Sprint rows act as headers, for example:
- Sprint
1 - Sprint
2 - Sprint
3
Under each sprint, use decimal codes for backlog items such as 1.1, 1.2, 2.1. In the “Task Name” column, enter the feature or user story name. This gives you a clear hierarchy and makes it easy to talk about items in planning sessions.
Keep sprint rows for real planning units (for example, 2-week sprints) rather than individual days. The chart works best when each sprint spans several days and collects a small group of related stories.
Step 3. Assign Owners and Story Points
In the “Responsible” column, enter the name of the person who owns the story. This person coordinates the work and updates status even if several people contribute.
Use “Story Points” to capture the relative size of each backlog item. You can follow your existing scale (for example 1, 2, 3, 5, 8, 13). If your team prefers hours, you can treat this field as estimated effort instead, as long as everyone shares the same interpretation.
Sort or filter by Story Points within a sprint when planning. Filling a sprint with a mix of small and medium stories is easier to manage than loading it only with large items.
Step 4. Add Dates, Duration, and Risk Flags
For each backlog line, enter “Start” and “Finish” dates that fall within the sprint row above it. The “Duration (in days)” field reflects how long that item is expected to be active, not necessarily full-time work.
The “At Risk?” column lets you mark “Yes” for items that may miss their intended finish date or depend on external decisions. Use this flag sparingly so it truly highlights work that needs attention.
Update the “Status” field to reflect the current state of each story such as Complete, In Progress, Overdue, On Hold, Approved, Needs Review, or Not Started. Use “Comments” for short notes like “Foundation set,” “Midway check,” or “Launch prep.”
Status labels use conditional formatting, so choosing a value such as Overdue or Approved automatically applies the matching colour. This keeps the sprint backlog readable even when the list is long.
Step 5. Maintain the Schedule Chart
The chart at the bottom shows each sprint and feature as a horizontal bar on a date axis. After you enter or adjust dates in the table, drag or resize the bars so they line up with those dates. Sprint bars usually cover the entire sprint window, while feature bars cover only the segment where work is expected.
During stand-ups or review meetings, you can scroll between the table and the chart:
- The table supports detail (owners, story points, status, comments).
- The chart shows when stories overlap and where idle gaps or overloaded periods appear.
FAQs
You can treat the sprint rows as broad time buckets such as “April Work,” “May Work,” or “Release 1 Prep” rather than formal two-week sprints. Keep the backlog items listed underneath and still use Story Points, Status, and the At Risk flag. On the chart, extend bars according to when you expect to work on each cluster of tickets. The template then becomes a time-lined Kanban view rather than pure scrum.
During each review, count roughly how many story points are in the Complete status compared with the total story points in the backlog. If half the points are done, set Overall Progress near 50%. It does not need to be exact; the value is mainly used for reporting and for spotting big changes from one review to the next.
If a story is truly large, break it into smaller backlog items such as “Feature 2 – backend,” “Feature 2 – UI,” “Feature 2 – tests” and place them under the appropriate sprints with their own story points and dates. Only keep a single story across multiple sprints when you deliberately treat it as an epic, and in that case, use one epic row with subtasks underneath so the chart still shows clear start and finish points.
Yes. Edit the Status dropdown list to match the vocabulary your team uses (for example “Blocked” instead of “On Hold”) and update the conditional formatting rules so each new label keeps a distinct colour. After these changes, picking a status from the dropdown will still highlight the cell correctly and keep the legend on the right side aligned with your custom labels.
If your schedule extends beyond the default date range, add more columns to the chart area and copy the existing date pattern across. Then stretch the sprint and feature bars into the new columns. Make sure the Start and Finish dates in the table stay in sync with those extended bars so the visual timeline remains accurate.