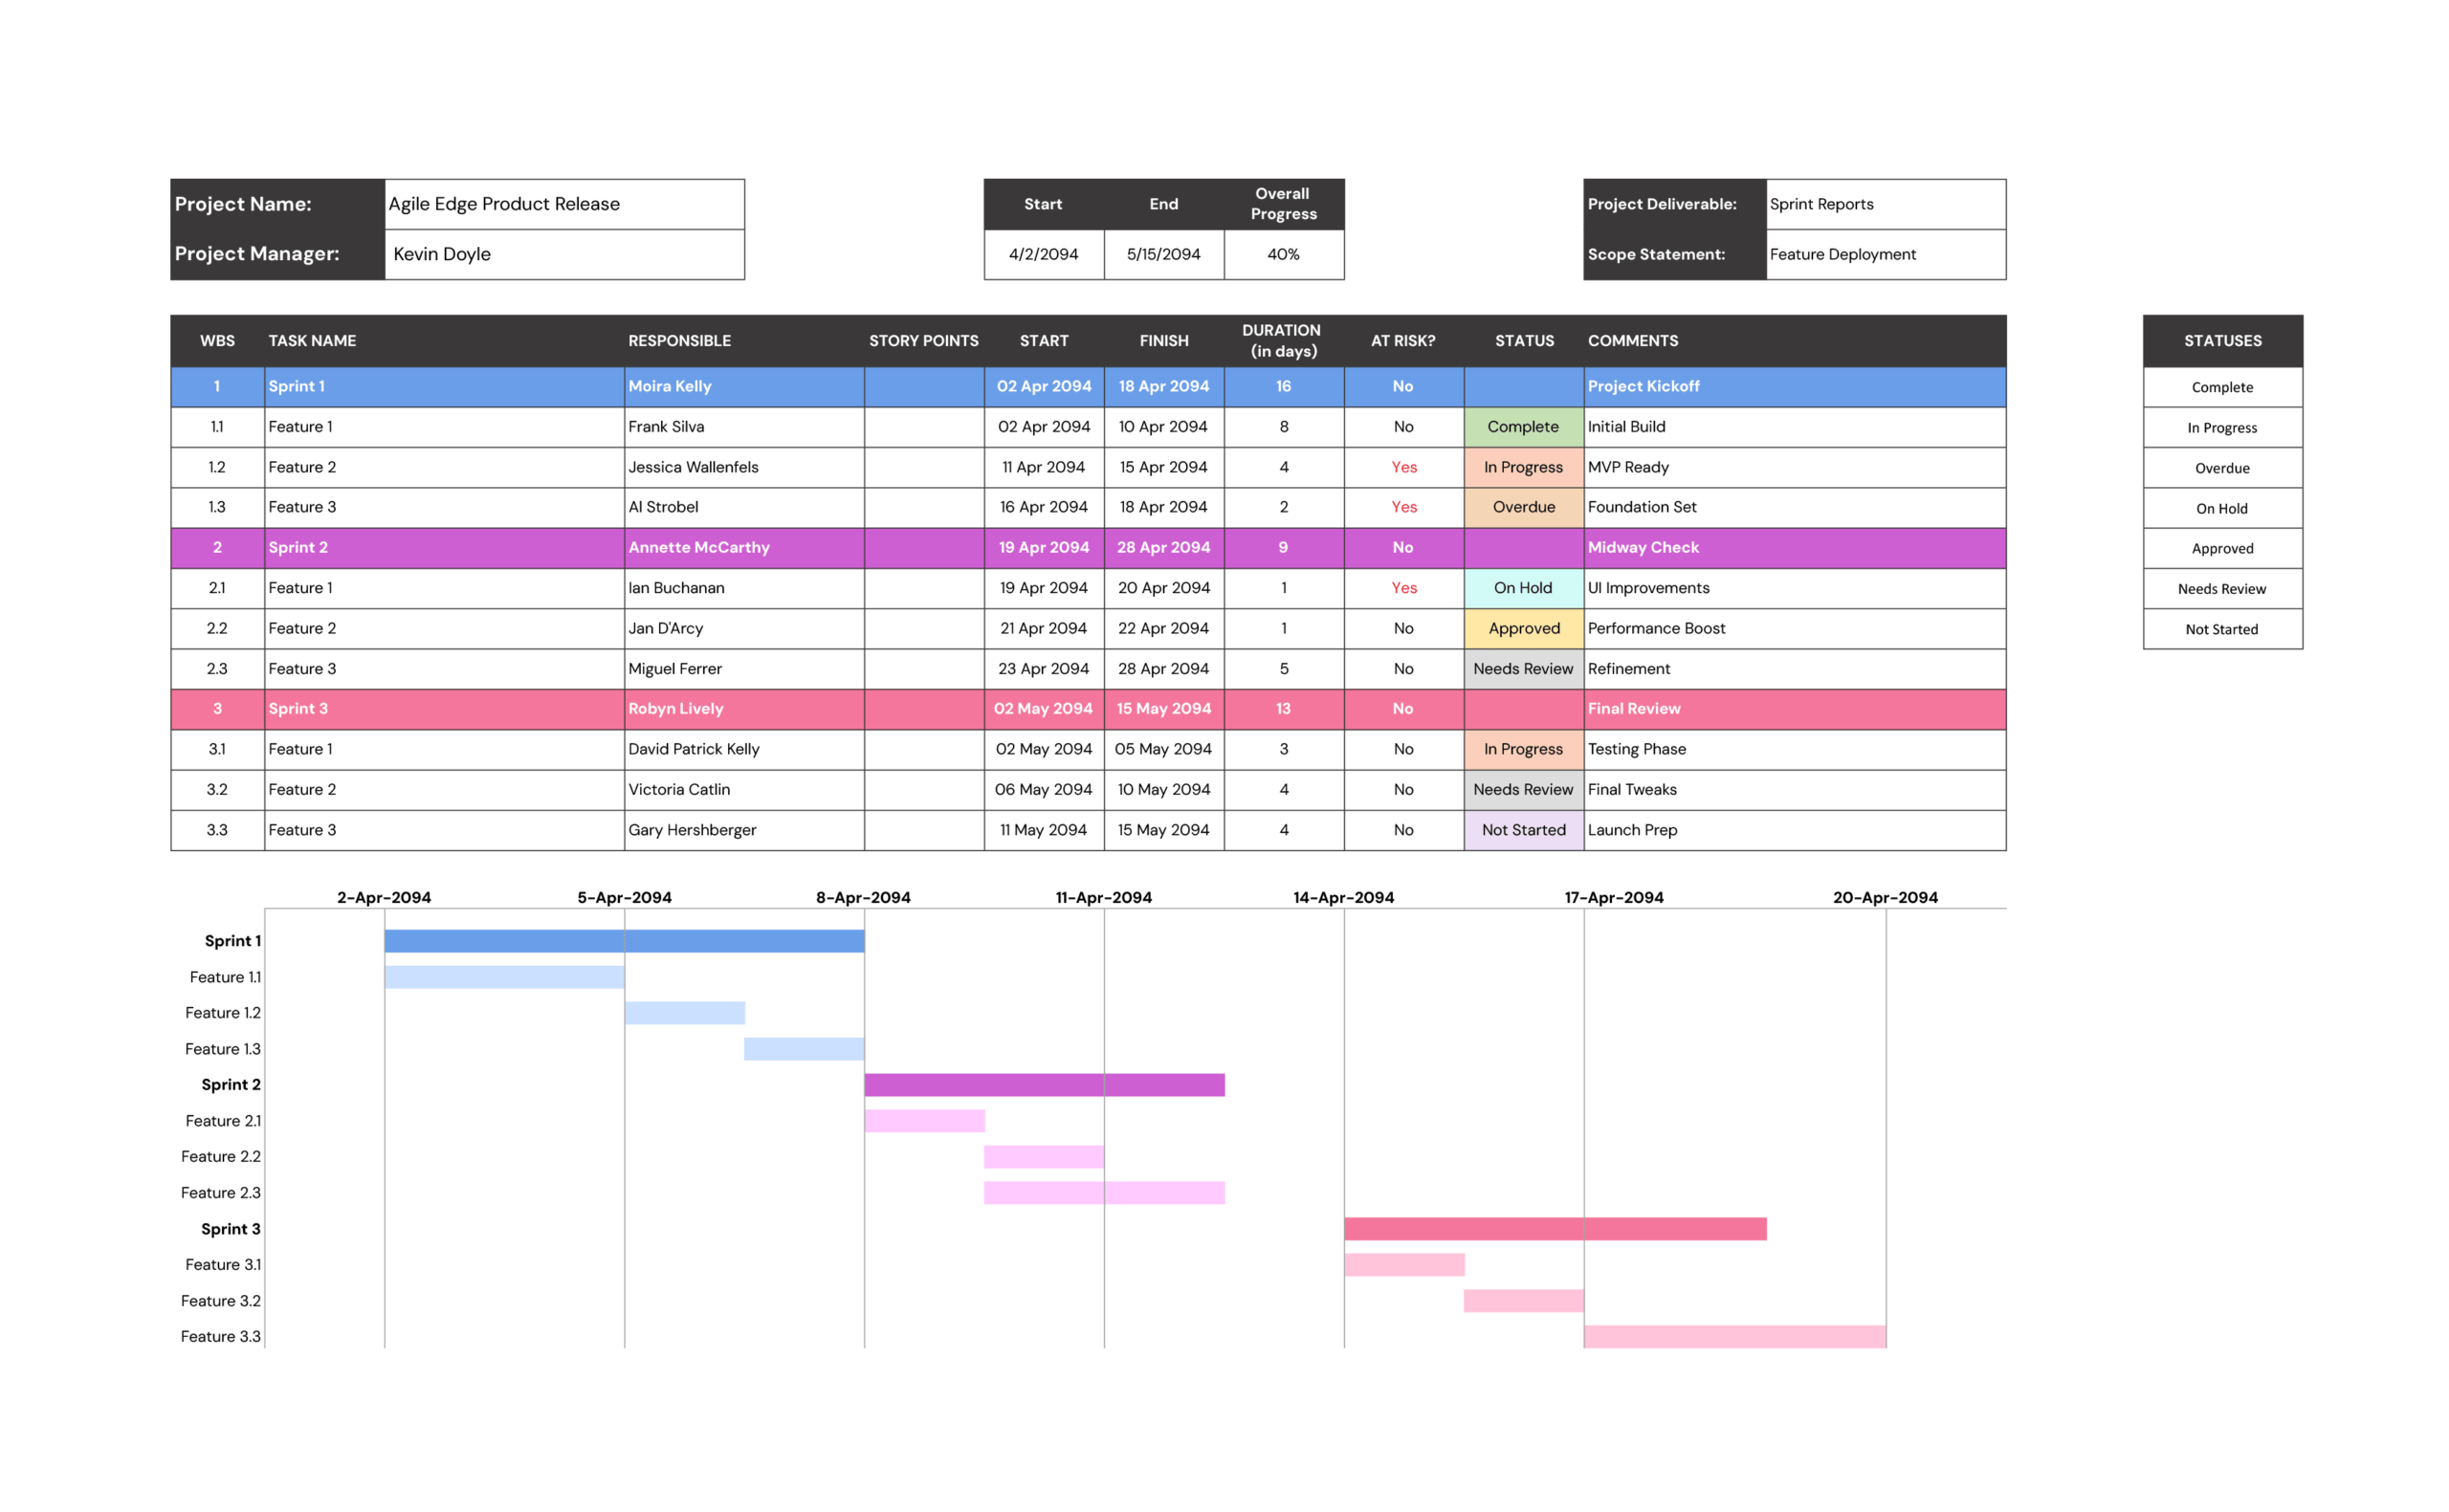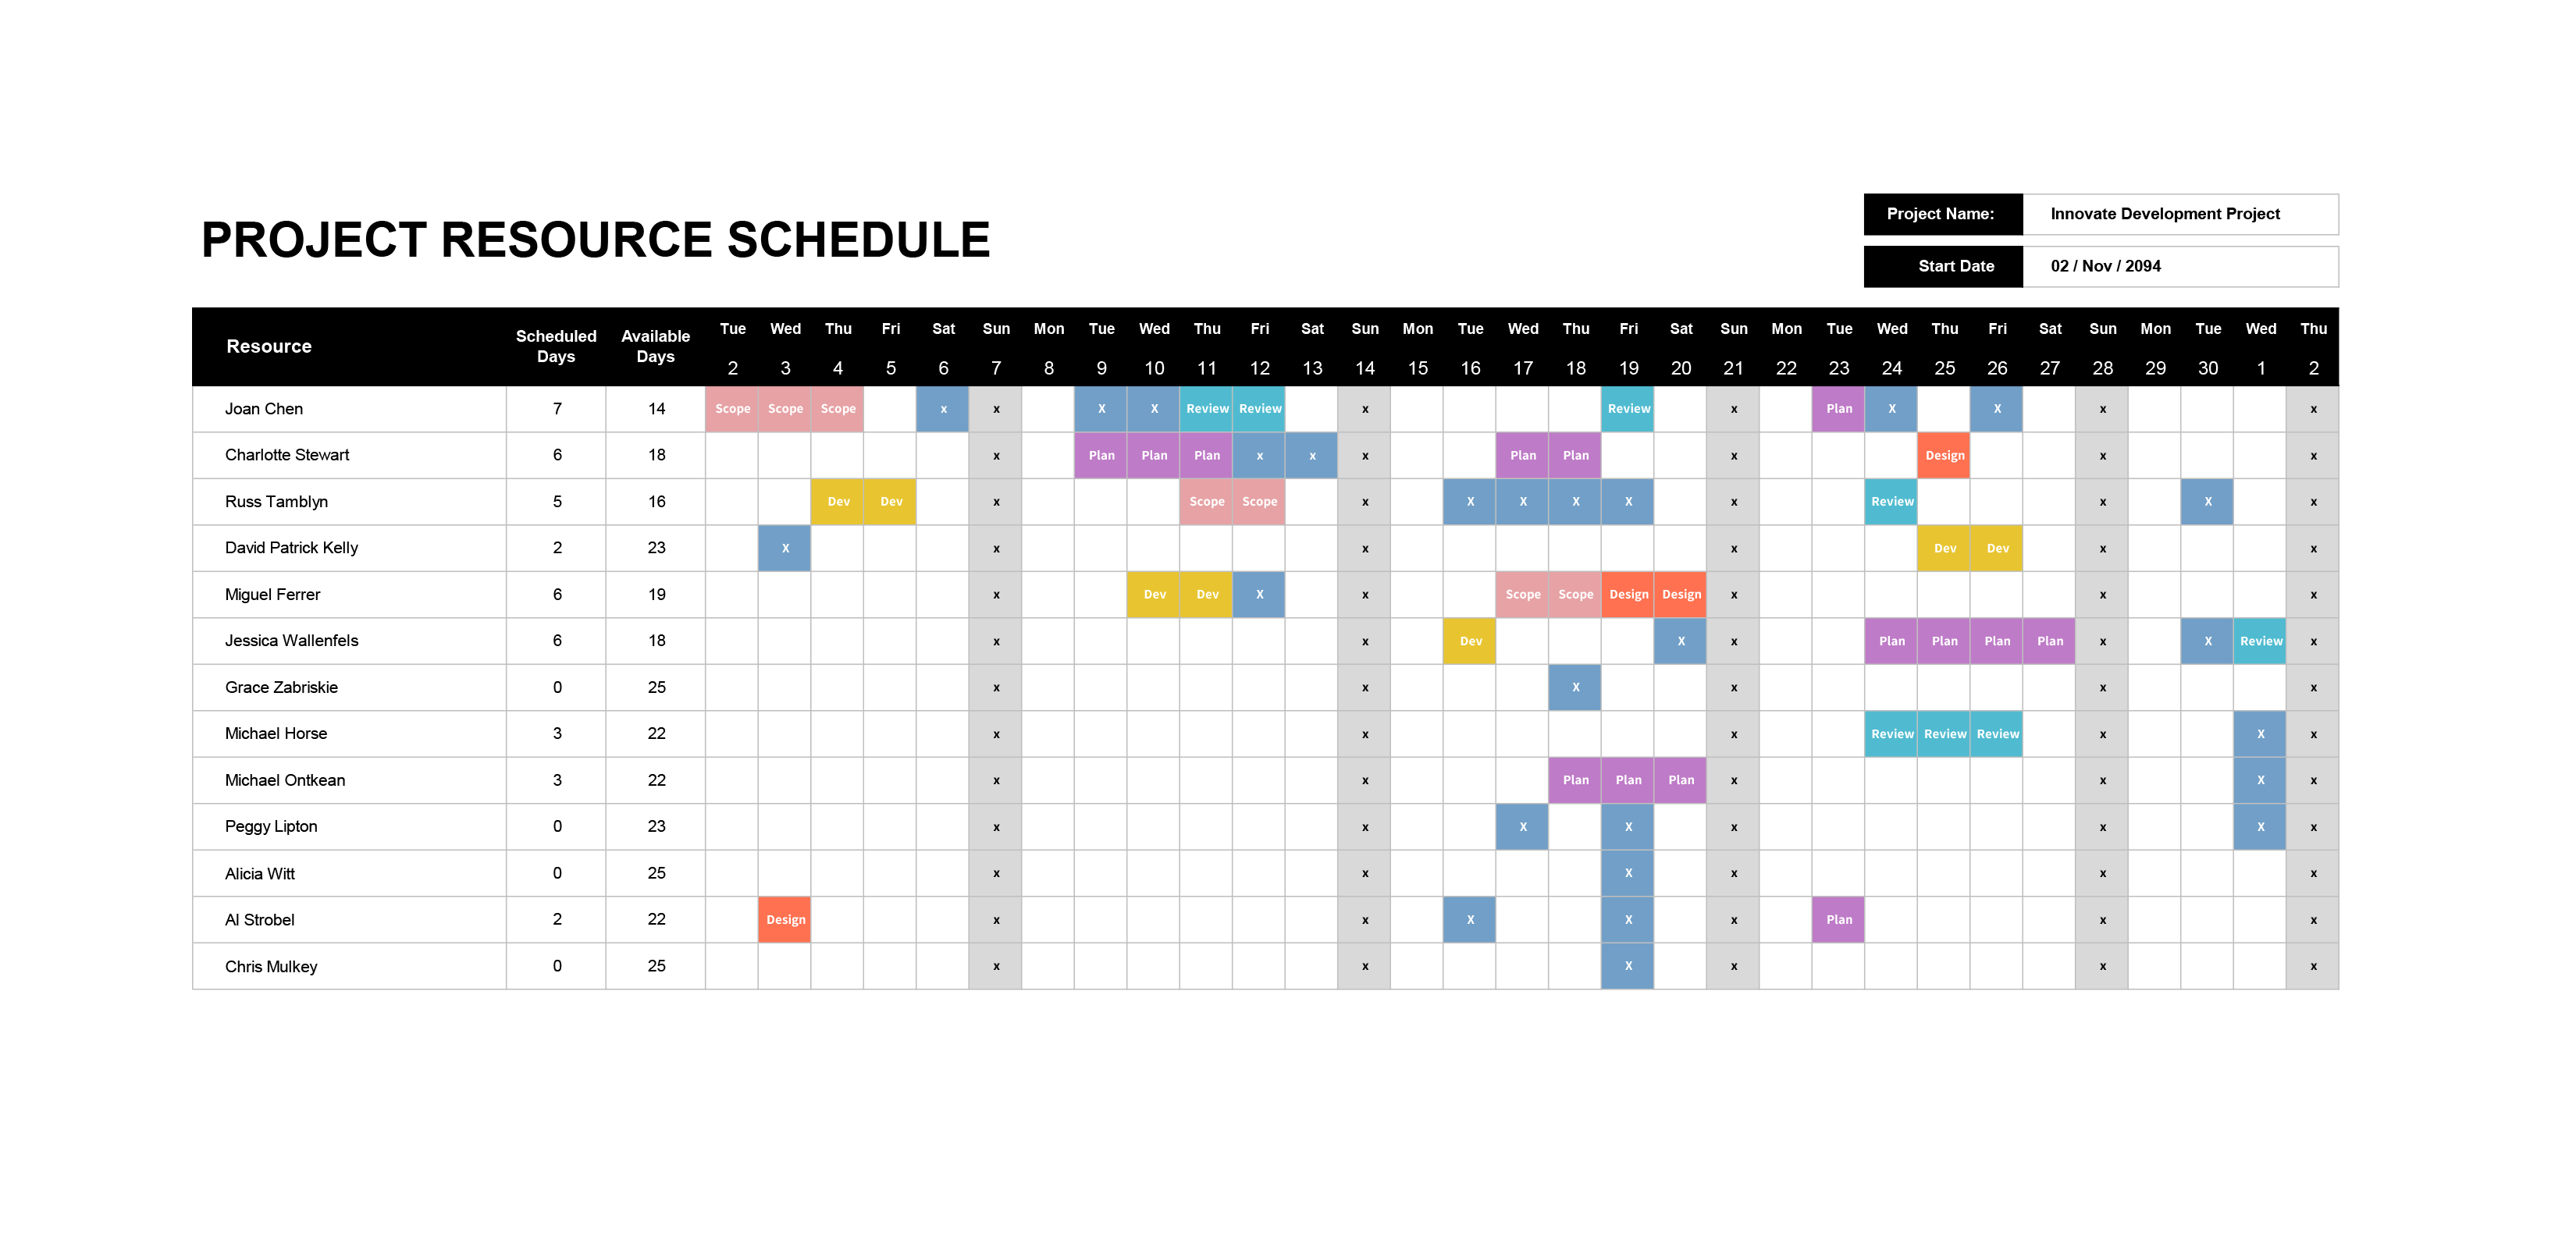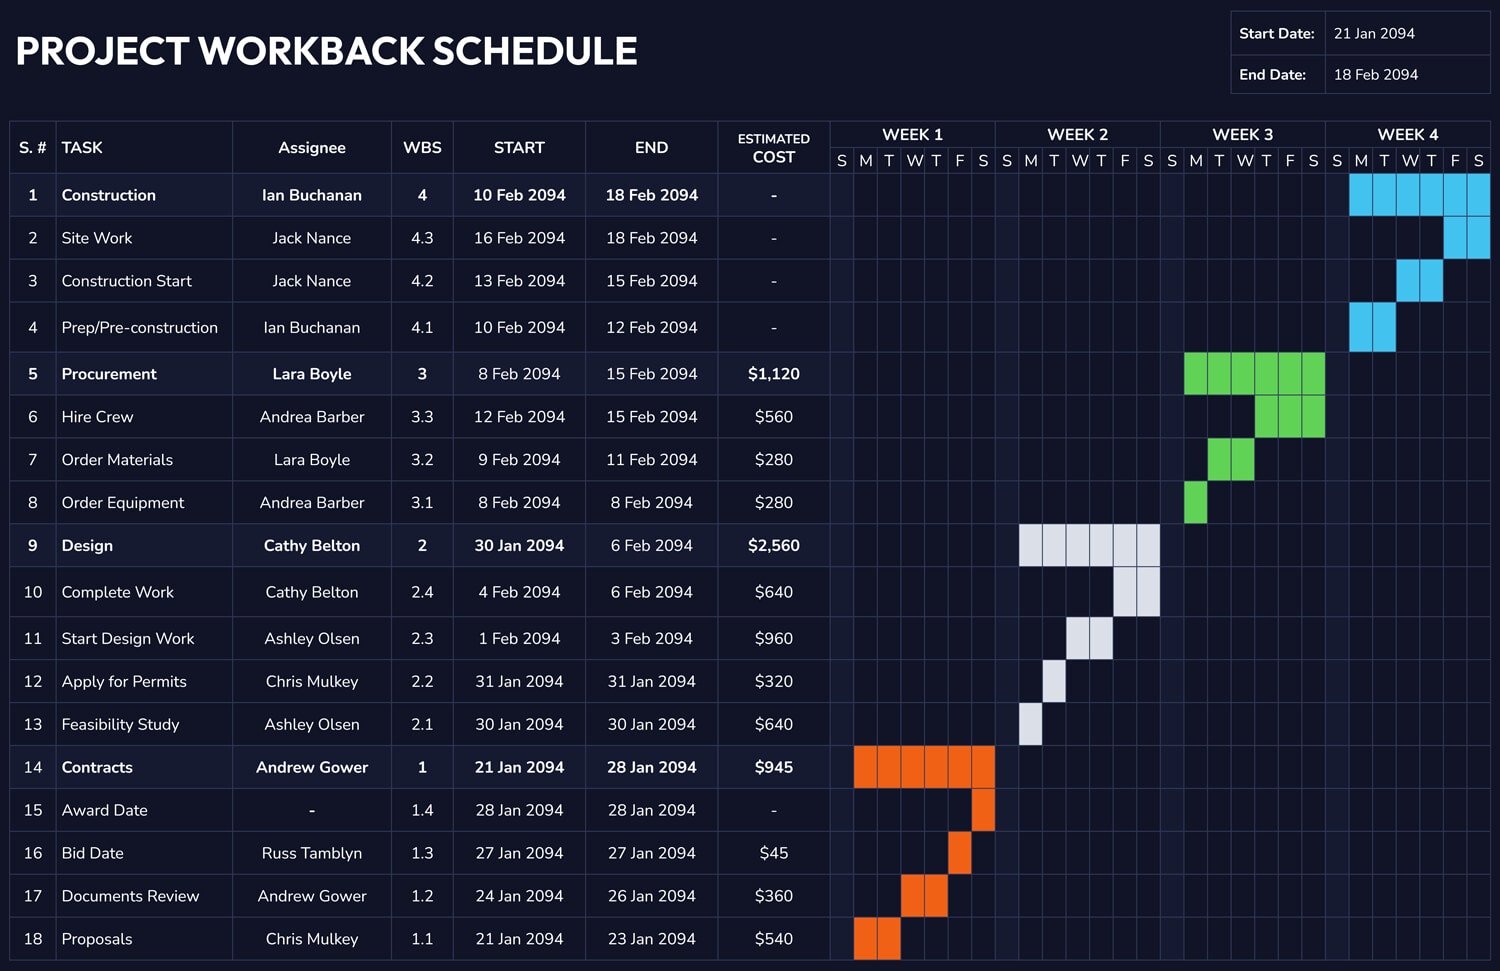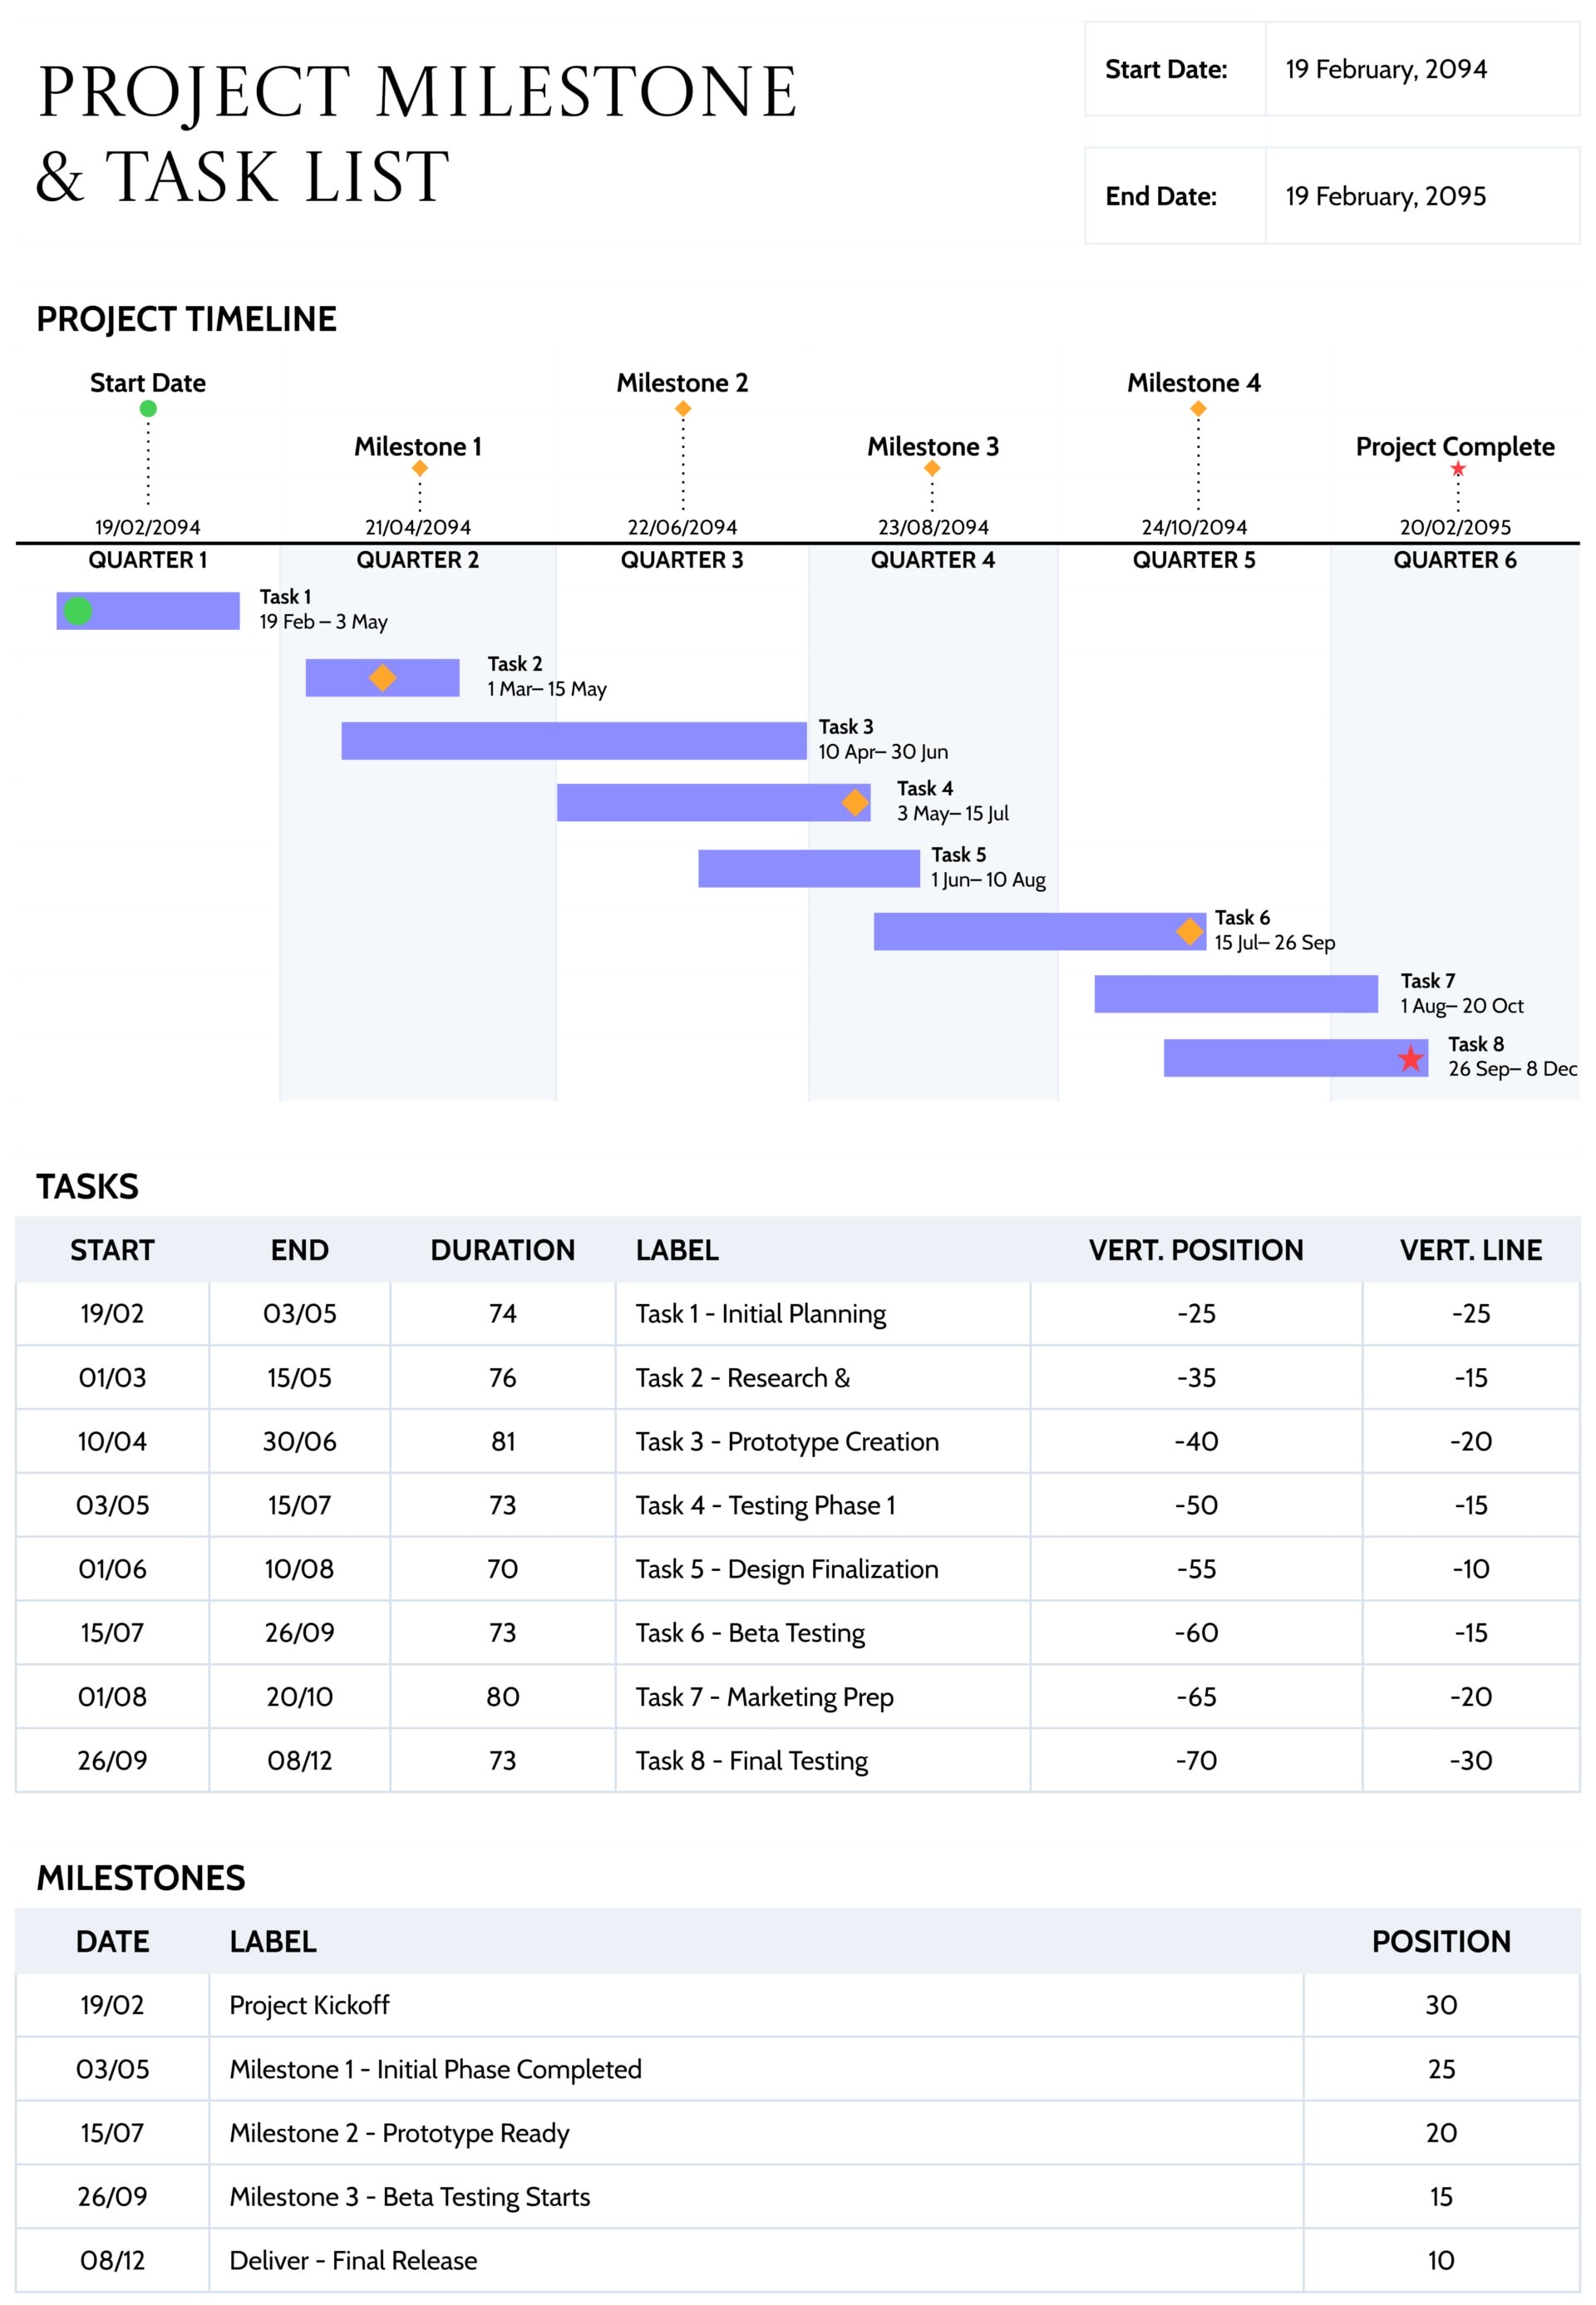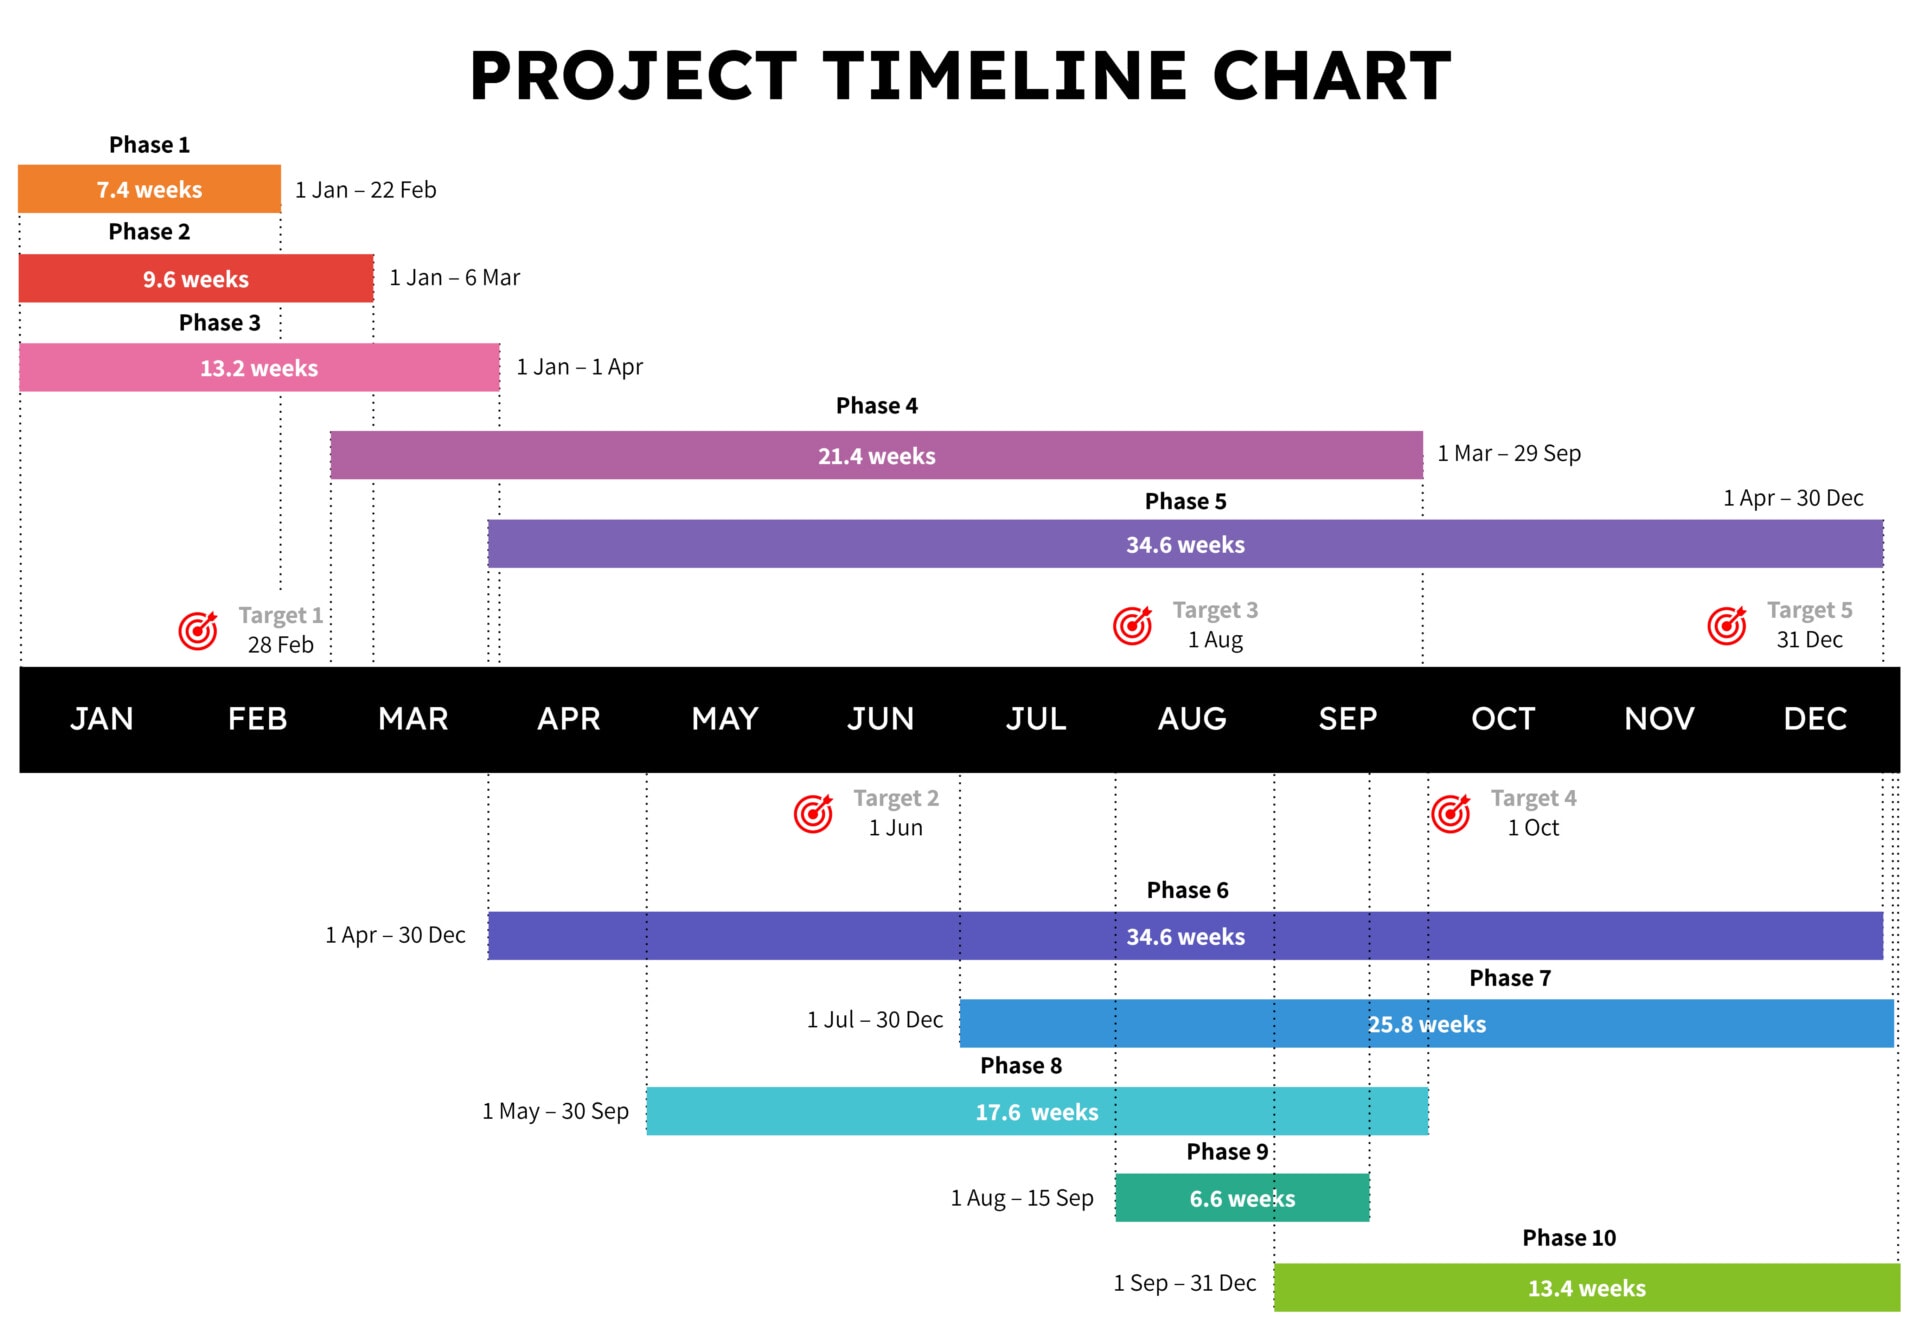
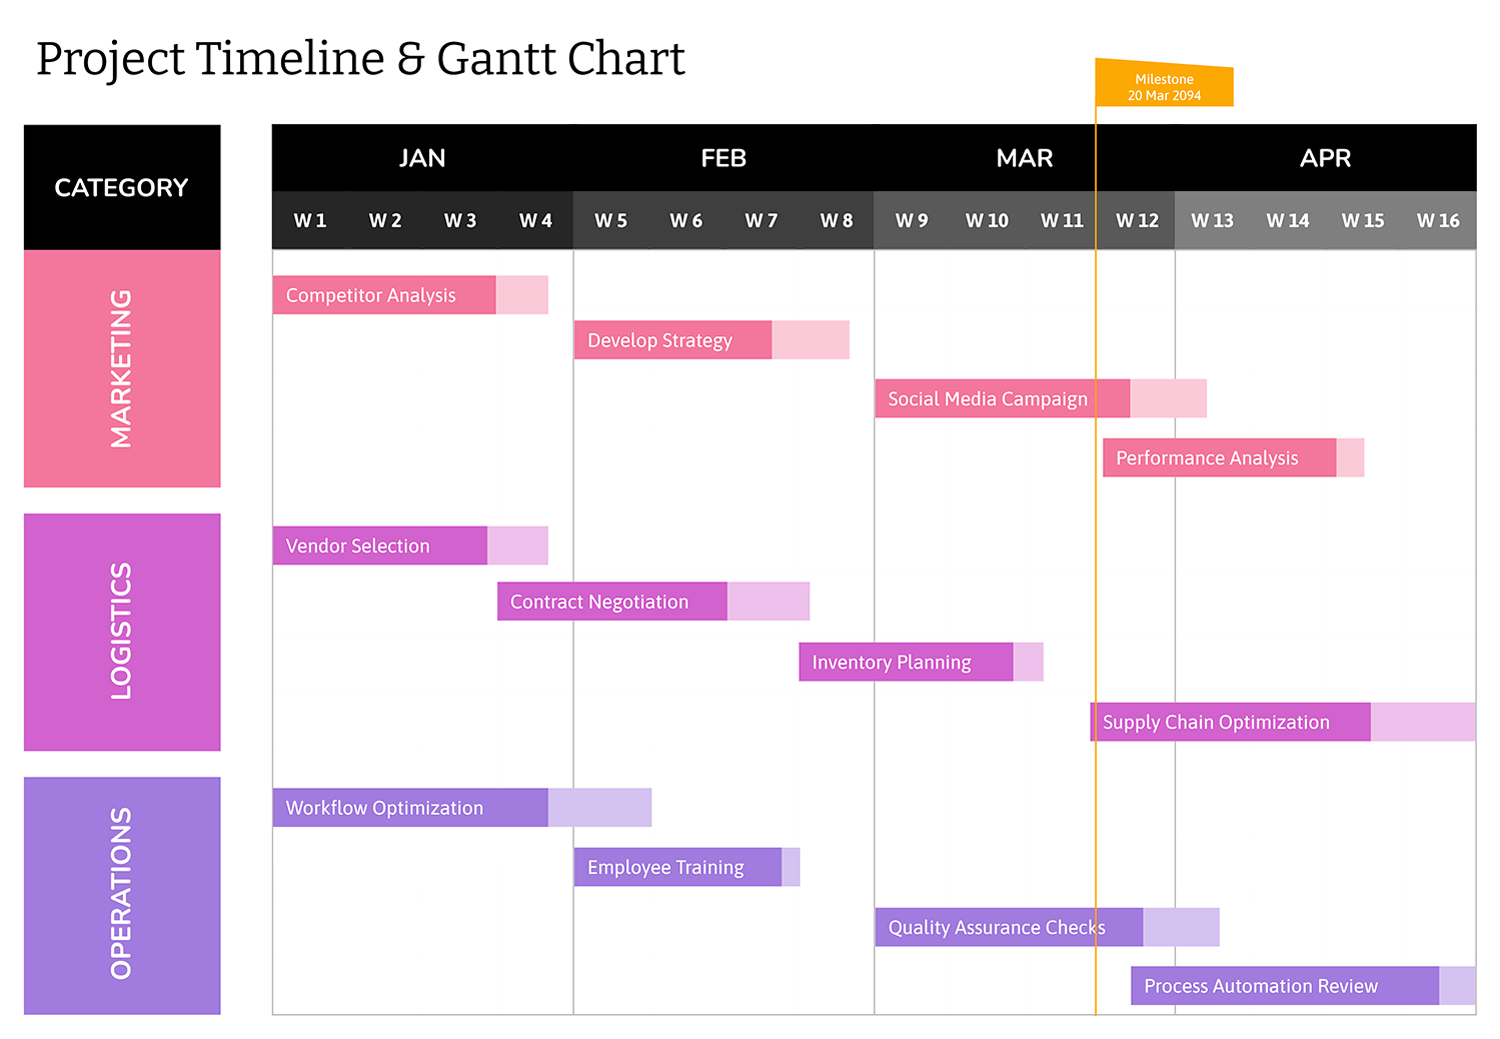


This simple project timeline and Gantt chart template suits short cross-functional projects where marketing, logistics, and operations teams need a shared view of work across a four-month period. Tasks are arranged in three colored bands on the left, one for each category. Months and weeks appear along the top of the chart, so marketing activities, logistics steps, and operational tasks are displayed together on a single slide for planning, coordination, and review.
How To Use This Template
The slide uses editable text boxes and colored bars. Each bar represents one task, aligned to the week columns that match its planned duration. A single milestone flag marks a key date such as launch or go-live.
Set Up Categories
Start by renaming the category labels if needed so they match your teams, for example Sales, Product, and Support. Keep one color per category so tasks are easy to scan during meetings.
Add Tasks and Durations
Replace the sample task names with your own activities, such as research, vendor selection, training, or rollout. Stretch or shrink each bar so it lines up with the correct weeks beneath the month headings. If a task spans several weeks, extend the bar across those columns; if it is short, keep the bar within a single week.
Arrange tasks so related work appears in the same band. For instance, keep all marketing tasks together and place dependent tasks later in the timeline, which makes handoffs between teams easier to understand.
Mark the Milestone
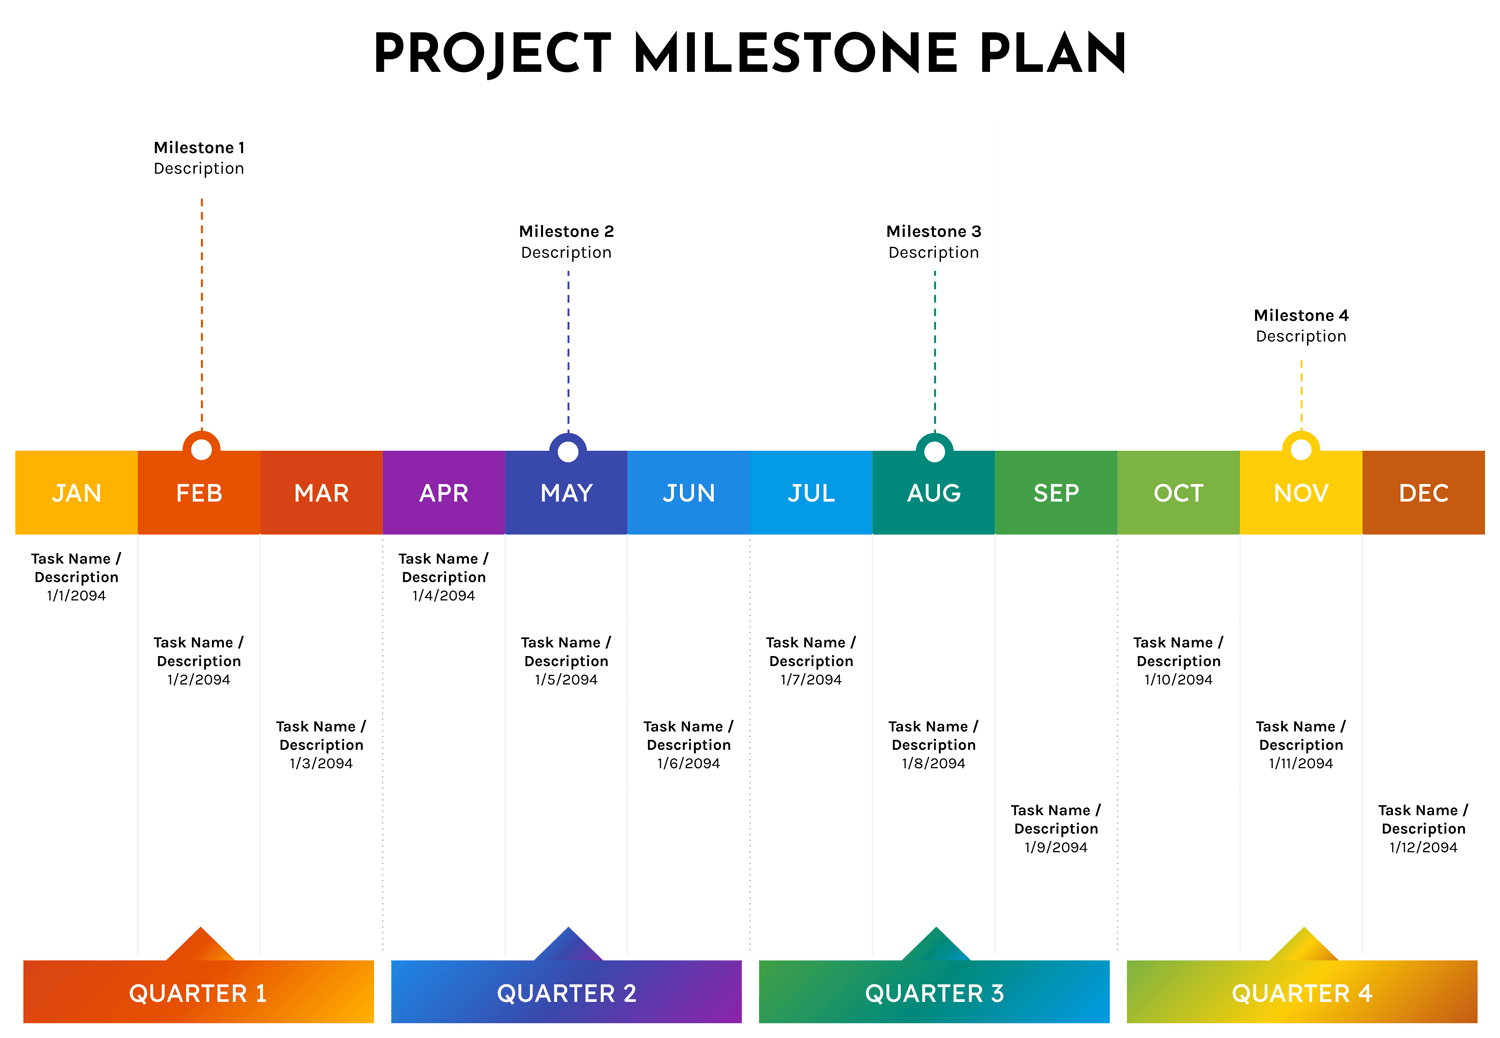
Use the milestone flag at the top of the chart to highlight a critical date such as campaign launch, contract signing, or product release. Move the vertical line to the appropriate week and update the milestone label with the correct date and name.
By anchoring the milestone first, you can see which tasks must finish beforehand and which can continue afterward, such as post-launch analysis or process optimization.
Use in Status Meetings
Once the schedule is in place, reuse this slide in weekly or biweekly check-ins. Update task bars if dates change and briefly note any delays or accelerations by adjusting bar length and position. The category bands on the left give stakeholders a quick sense of which group is busiest during each part of the schedule.
You can export the slide as a PDF or image for email updates, or keep it inside a larger deck that tracks objectives, risks, and decisions alongside the visual schedule.
Keep the number of tasks on this chart limited to major activities. Use it as a high level project timeline and Gantt chart, and keep granular checklists or task trackers in a separate file.