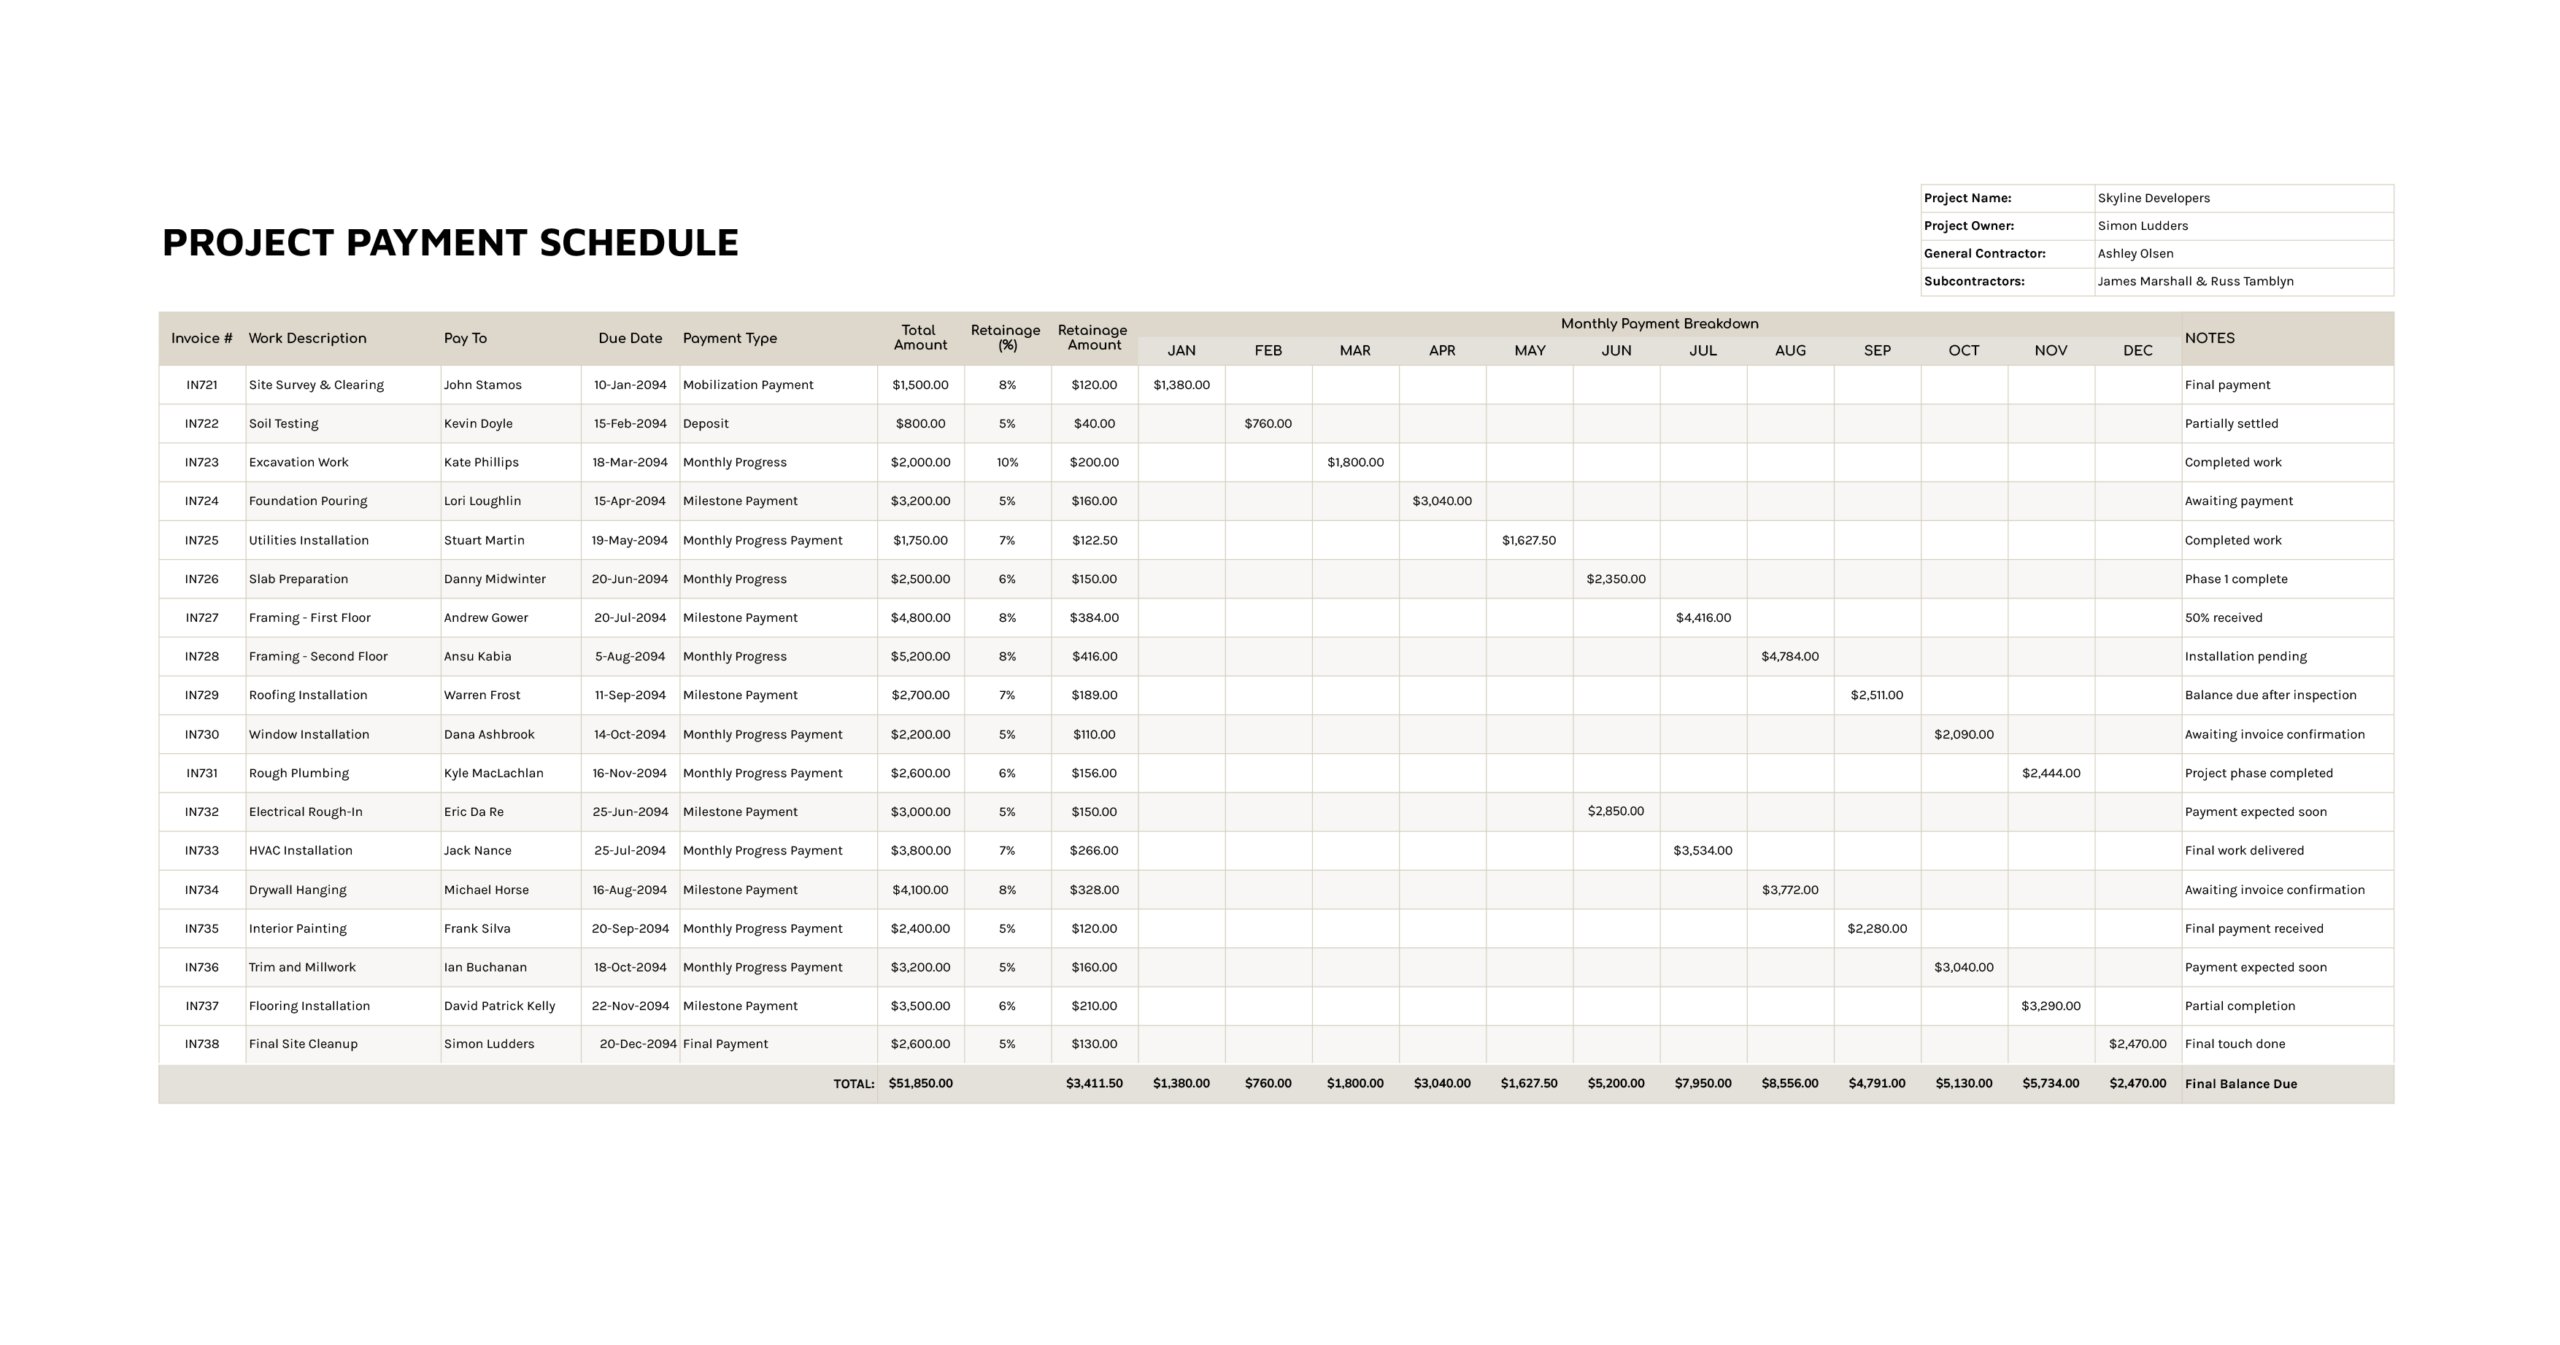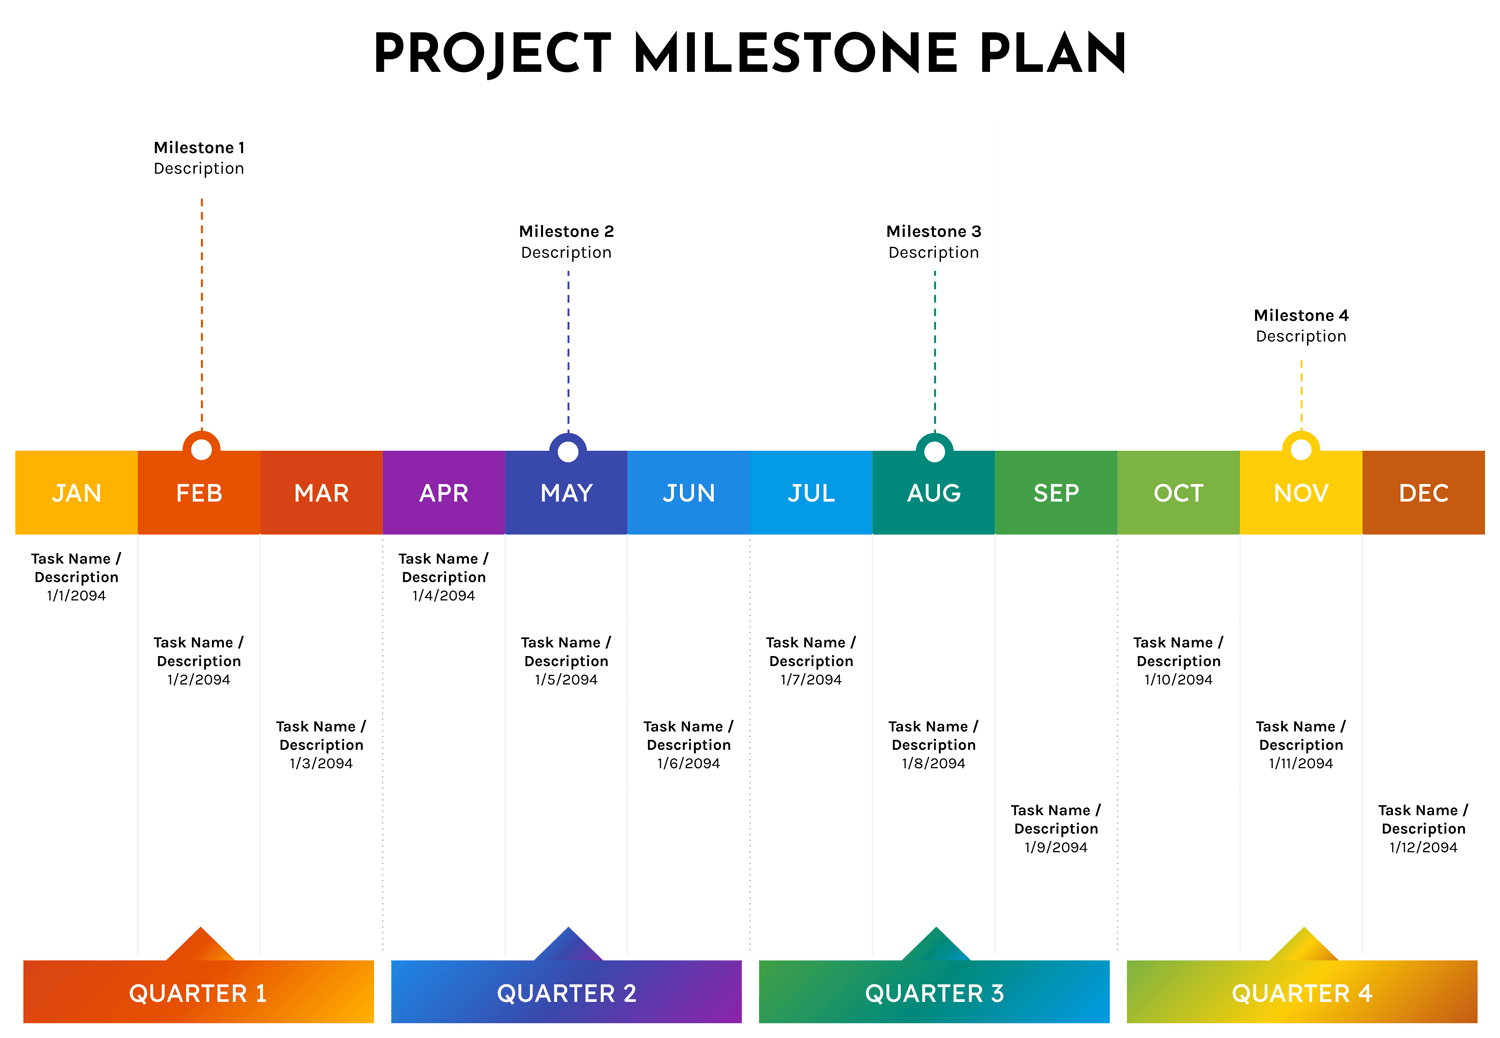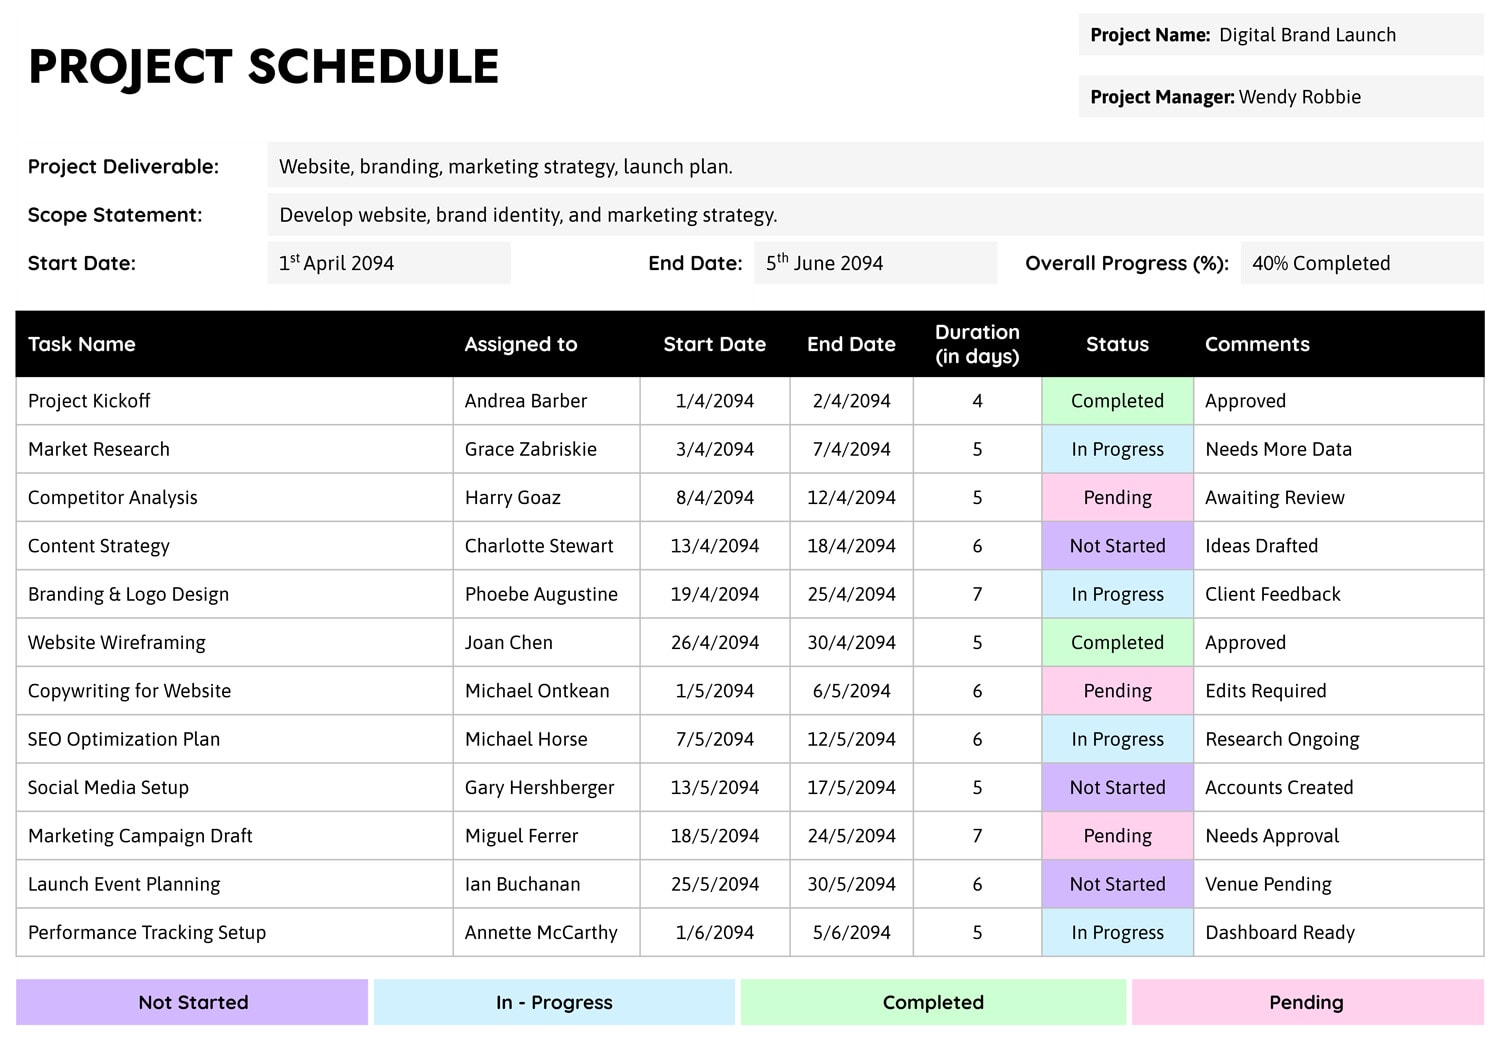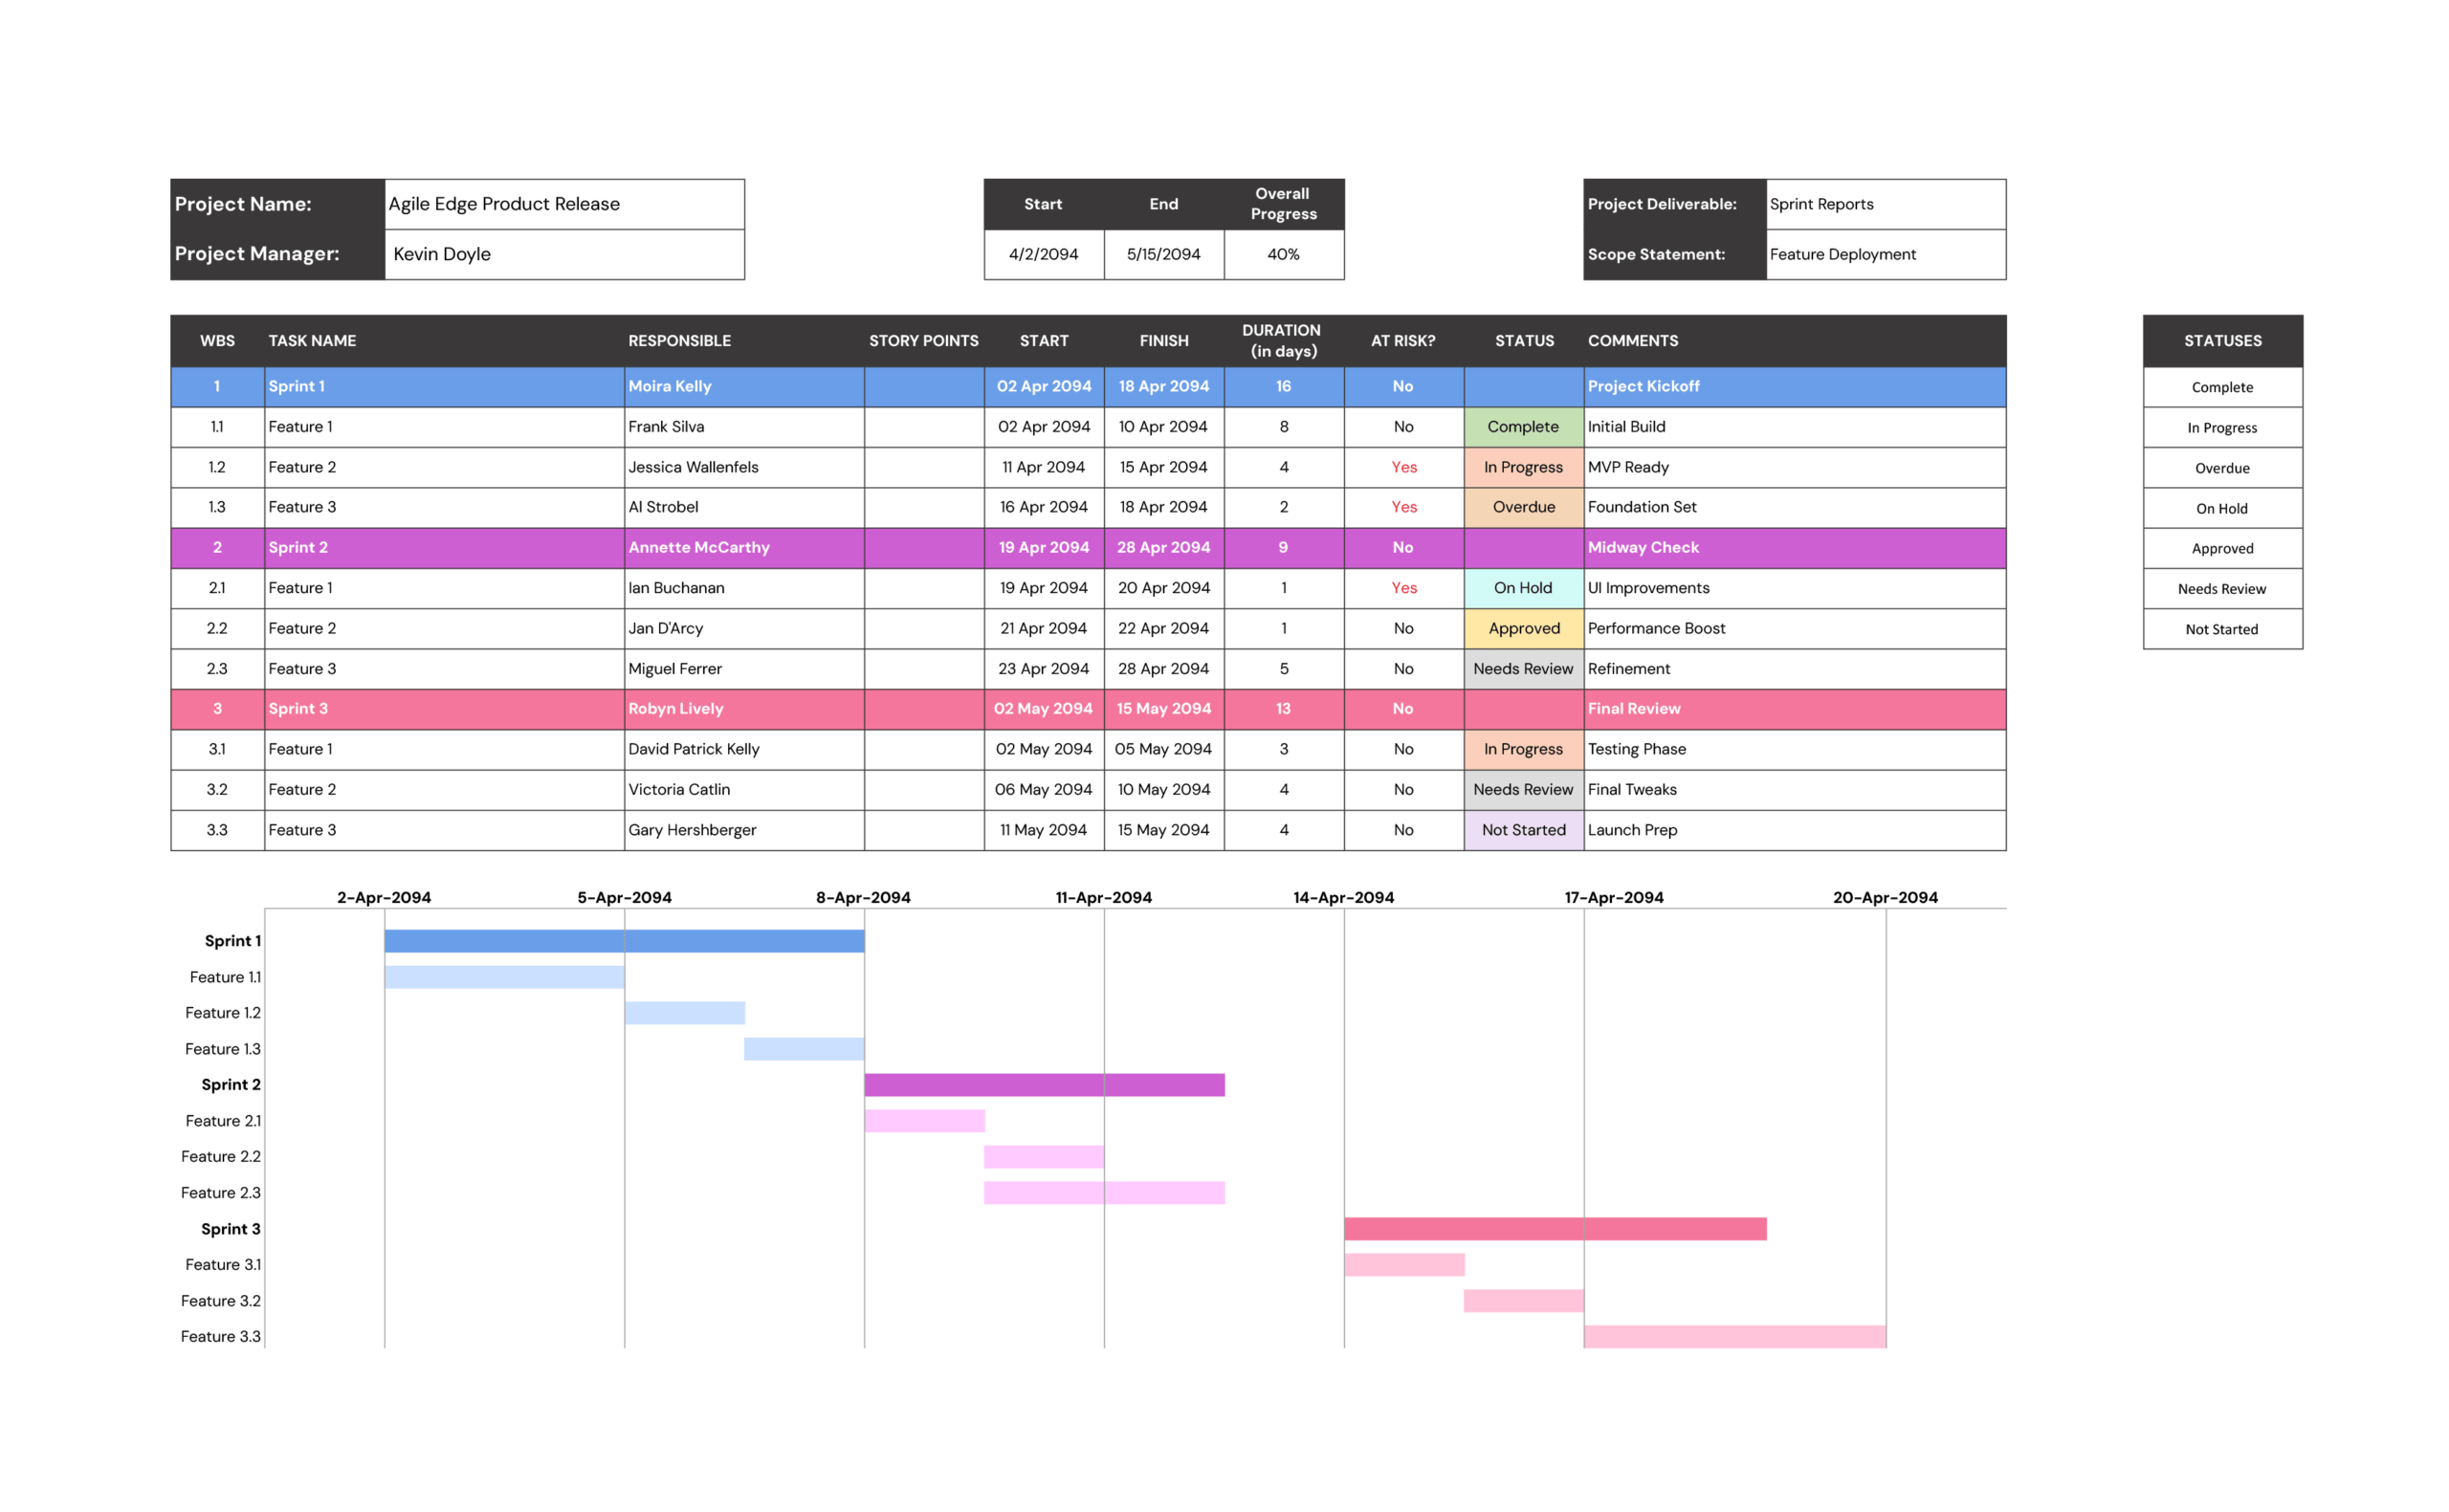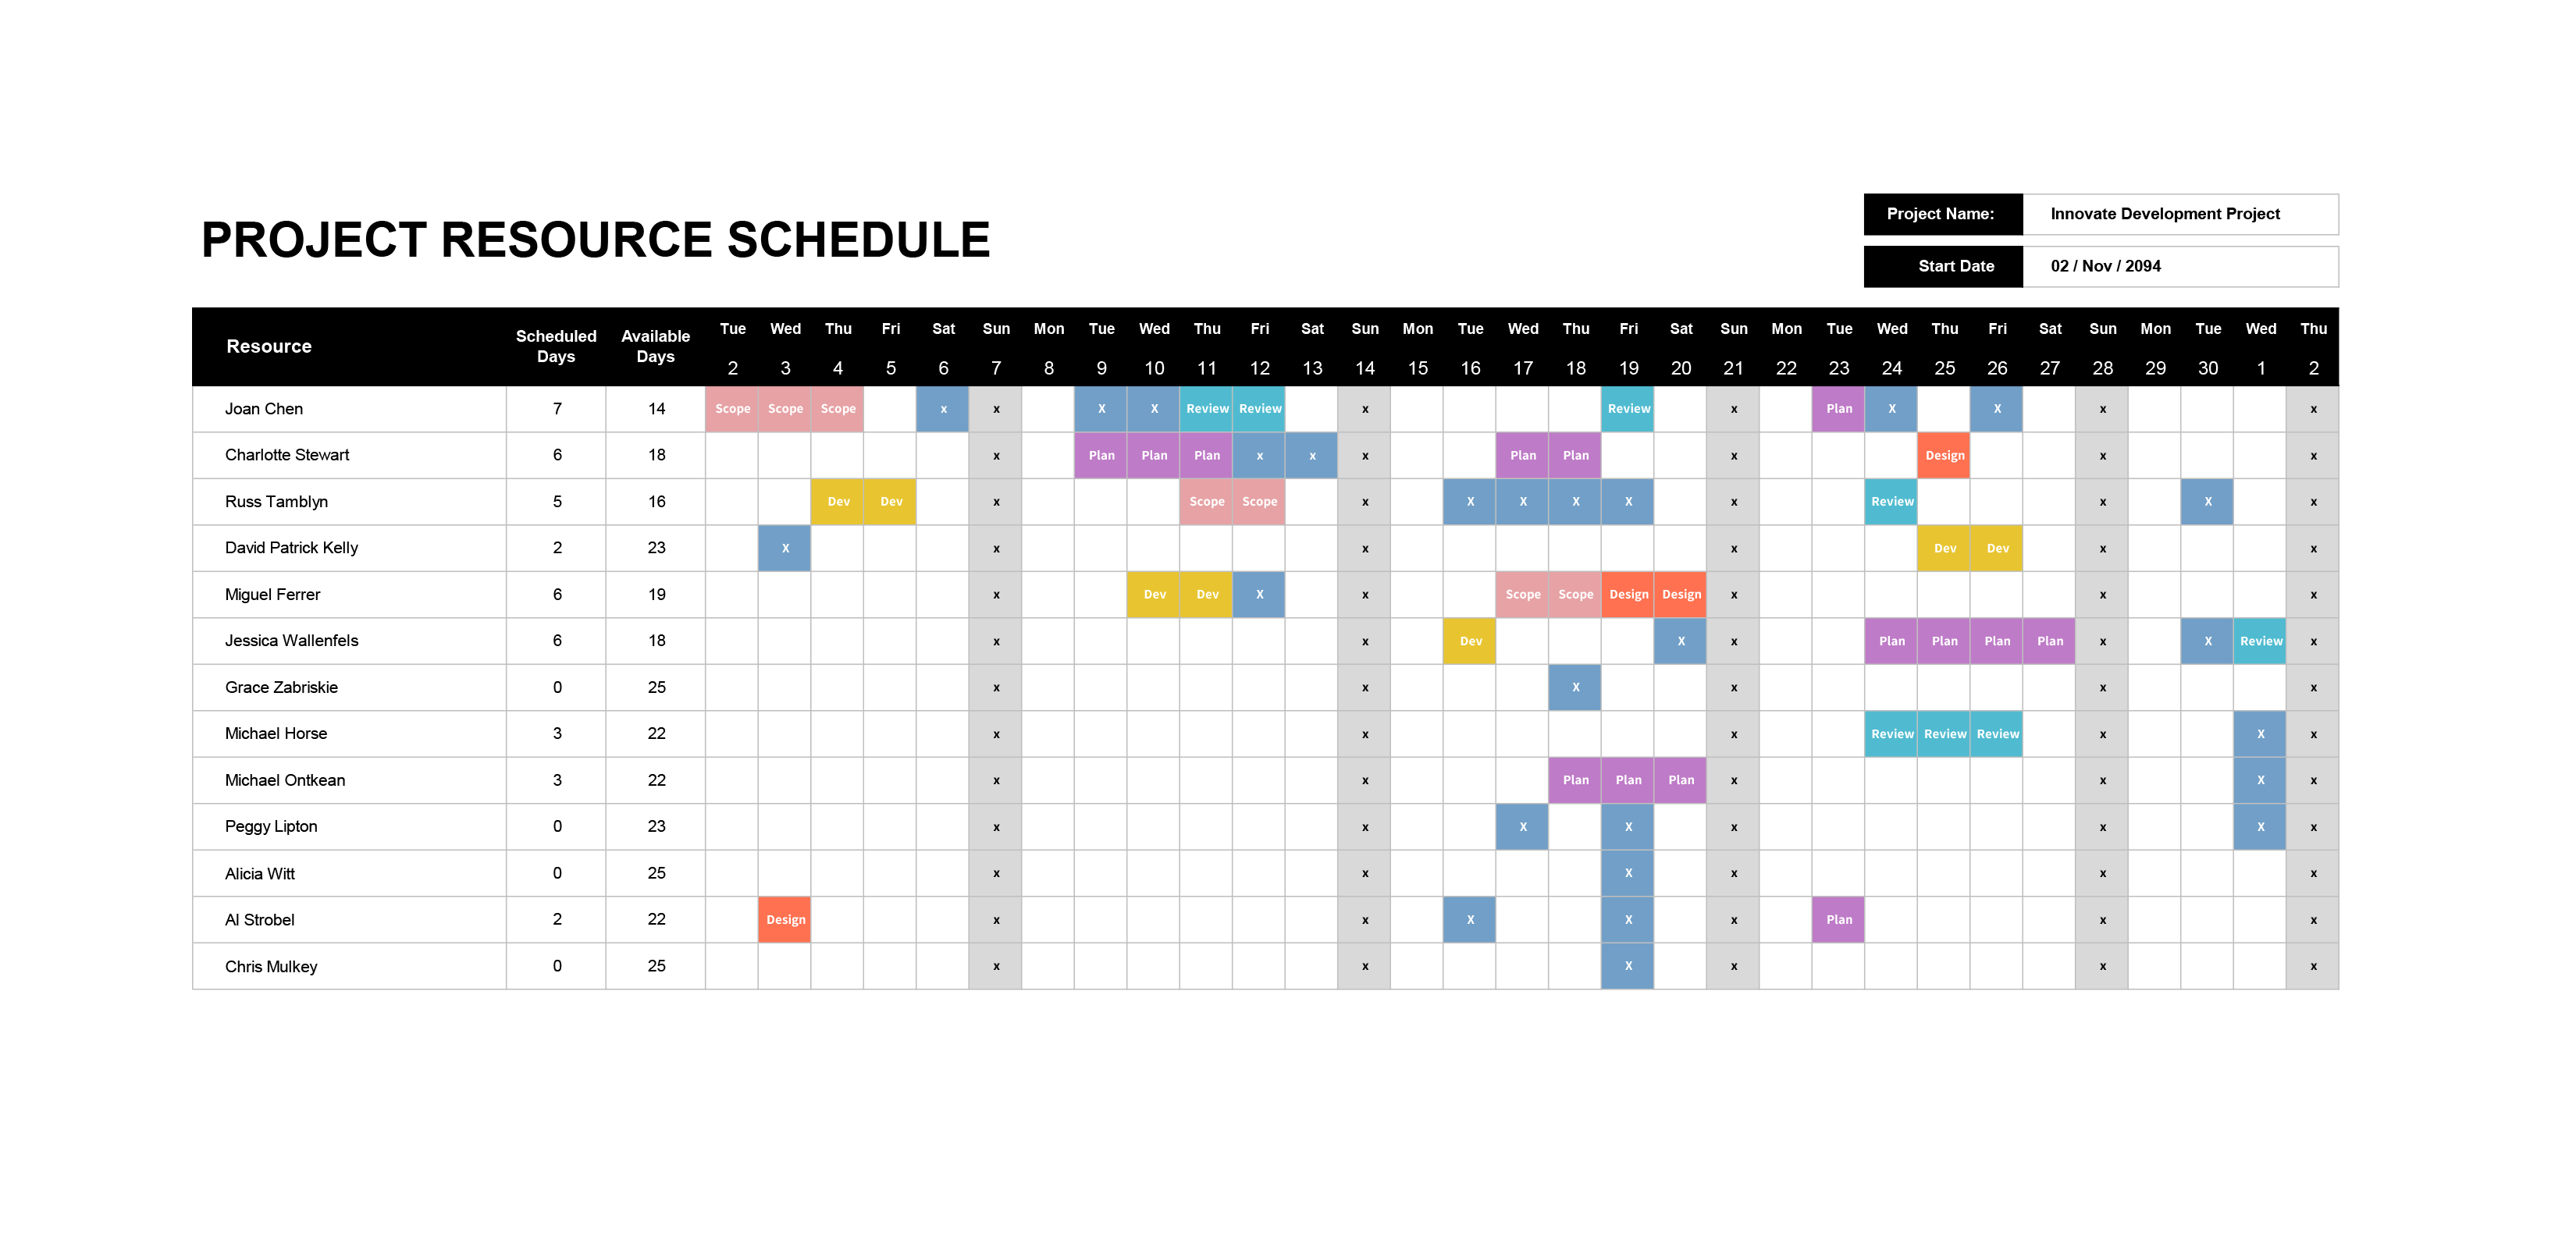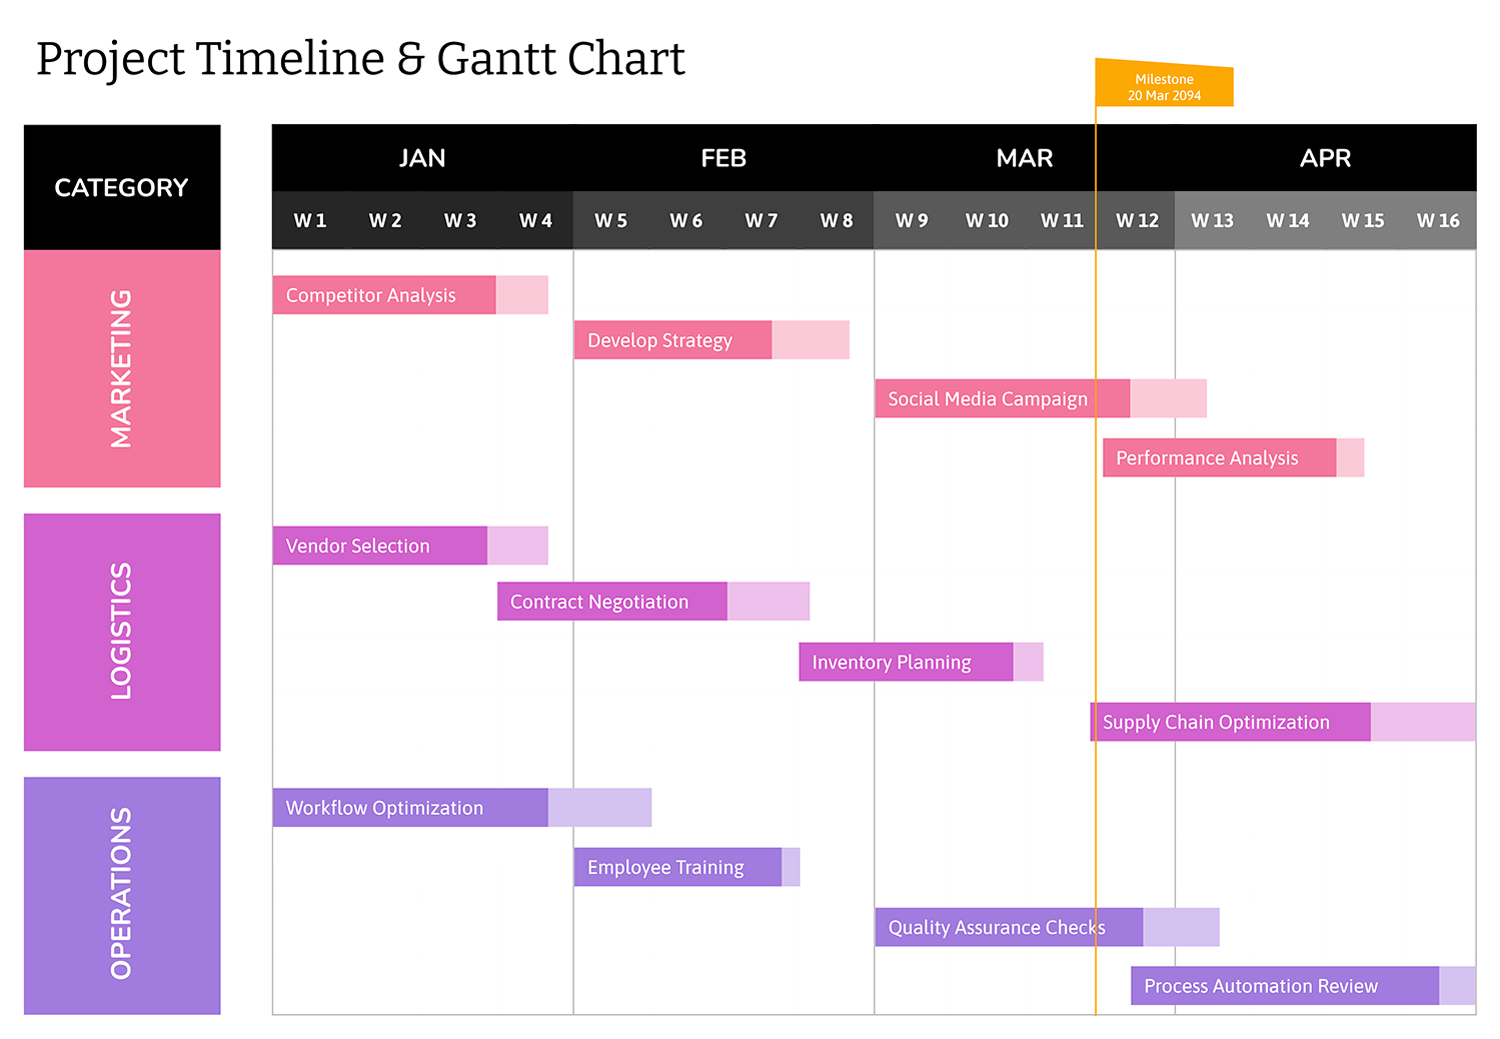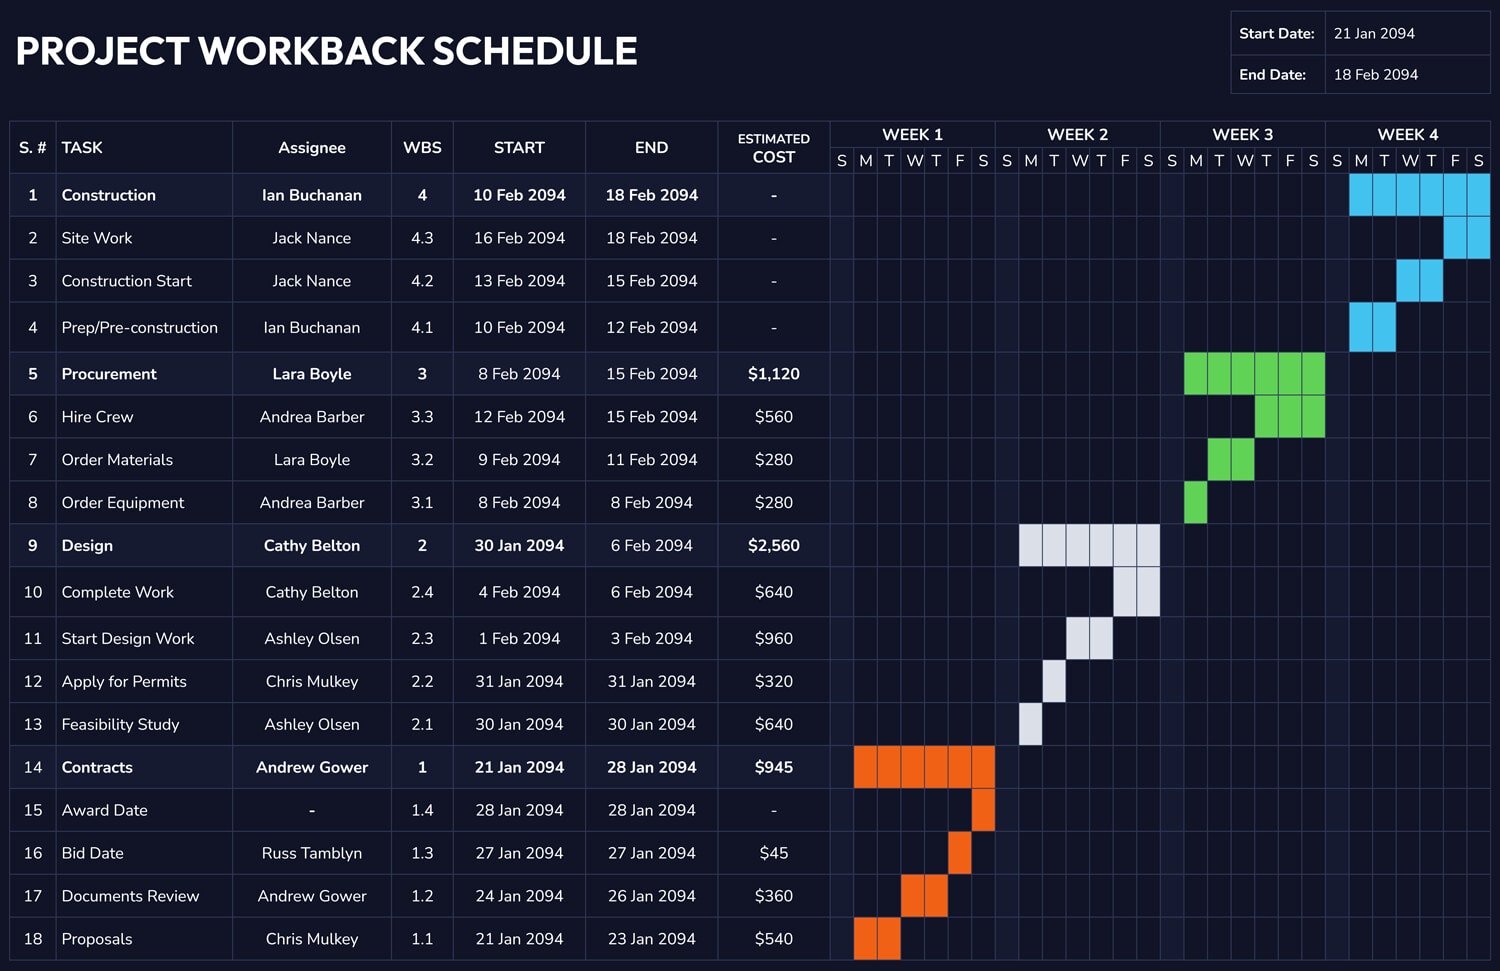
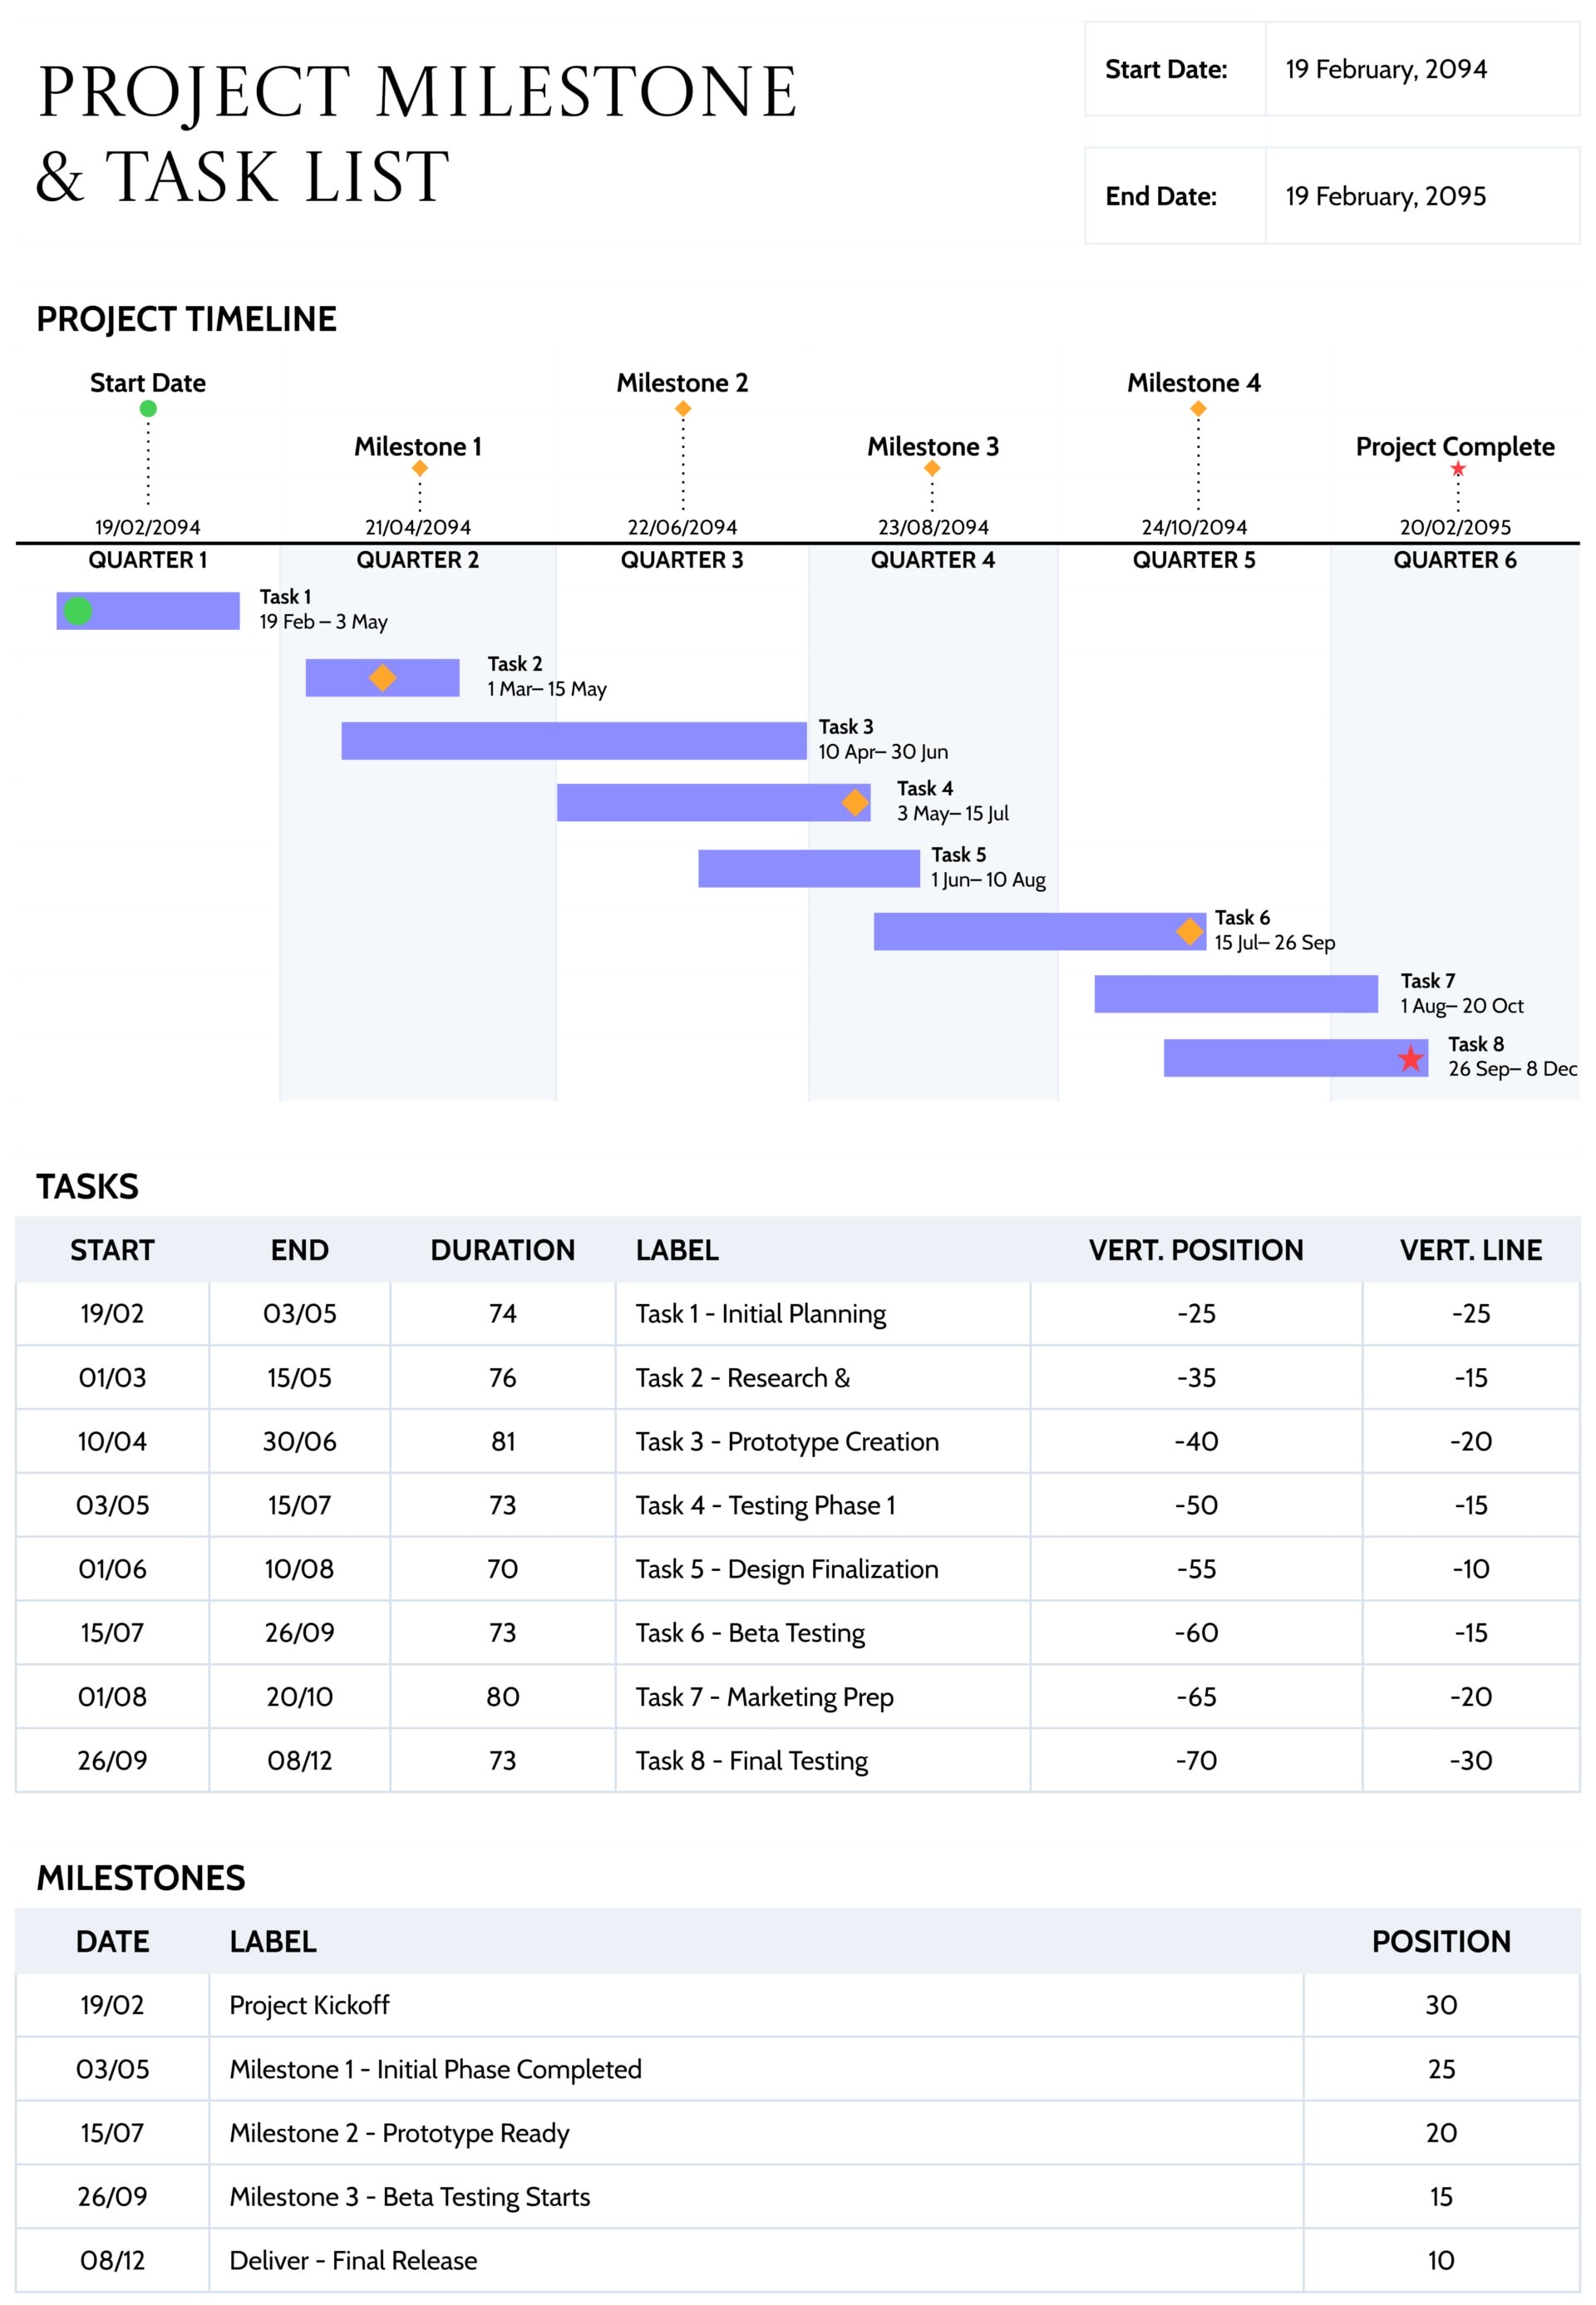


The project milestone and task list template is designed for projects that need both a high level timeline and a detailed task register on a single page. The upper timeline shows how tasks span across six quarters, while the tables below keep the underlying dates and milestone details organized. It works well for projects that run longer than a few months and require clear communication of major checkpoints, phase boundaries, and completion dates.
How To Use This Template
The slide is divided into two linked sections. The chart at the top is the visual summary. The task and milestone tables underneath store the data that informs the chart. Once the tables are updated, the timeline can be adjusted to match.
Set Up Overall Dates and Quarters
Begin in the panel on the right by entering the project start date and end date. These fields frame the entire schedule and provide context for stakeholders who need to know how long the initiative will run.
Across the top of the timeline, quarters are labelled from Quarter 1 to Quarter 6. Keep these quarter labels, or rename them to match your own phases or half years. The shaded background columns for each quarter make it easier to see which tasks start, finish, or overlap within the same period.
Populate the Task List
In the Tasks table, list each major task or work package on its own row. For every task, complete the following fields.
- Start date
- End date
- Duration in days
- Task label
Duration can be calculated from the start and end dates or entered manually if the timeline uses working days rather than calendar days. Task labels usually combine a short identifier and a plain language description, such as “Task 3 – Prototype Creation” or “Task 6 – Beta Testing.”
The final two columns, “Vert. Position” and “Vert. Line,” are provided for teams that want a systematic way to place task bars on the chart. They can be used as reference coordinates when aligning bars vertically and controlling where the connecting guide line appears. If that level of precision is not required, these fields can simply remain as internal layout notes.
Draw Tasks on the Timeline
Once the table is ready, move to the Gantt-style chart. Each bar on the chart represents one of the tasks listed in the table. Adjust the length and position of each bar so that its left and right edges line up with the corresponding start and end dates under the quarter headings.
Tasks that run back-to-back can be placed on adjacent rows to show progression through the project. Tasks that overlap can sit on staggered rows, which makes dependencies and parallel work easier to read. Keep labels short so they remain readable when viewed on a projector or in a shared screen.
Record and Place Milestones
The Milestones table at the bottom of the slide lists the key checkpoints in the project. For each milestone, add the date, a concise label, and a position value if you plan to use it as a layout guide. Typical entries might include project kickoff, prototype ready, testing start, and final release.
Above the chart, milestone symbols mark these dates on the timeline. Move each icon horizontally until it sits above the correct date and quarter, and update the label underneath so it matches the wording in the table. The final “Project Complete” marker aligns with the overall end date and signals when all work is expected to conclude.
Using the Template in Practice
This template can be maintained as the central milestone view for steering committee meetings, client check ins, or internal status reviews. During planning, the task table acts as a working list while the chart shows how long each piece of work will take and where it fits in the calendar. During execution, updates to dates and durations can be reflected in both the table and the timeline, so everyone continues to work from the same version of the plan.
For archival purposes, save different versions of the slide at important decision points, for example after initial approval, after a replan, or at project closure. This creates a visual history of how the schedule changed and which milestones were reached on time.
Update dates and durations in the task and milestone tables first, then adjust the bars and markers on the timeline. This routine keeps every version of the slide consistent and reduces date mismatches.