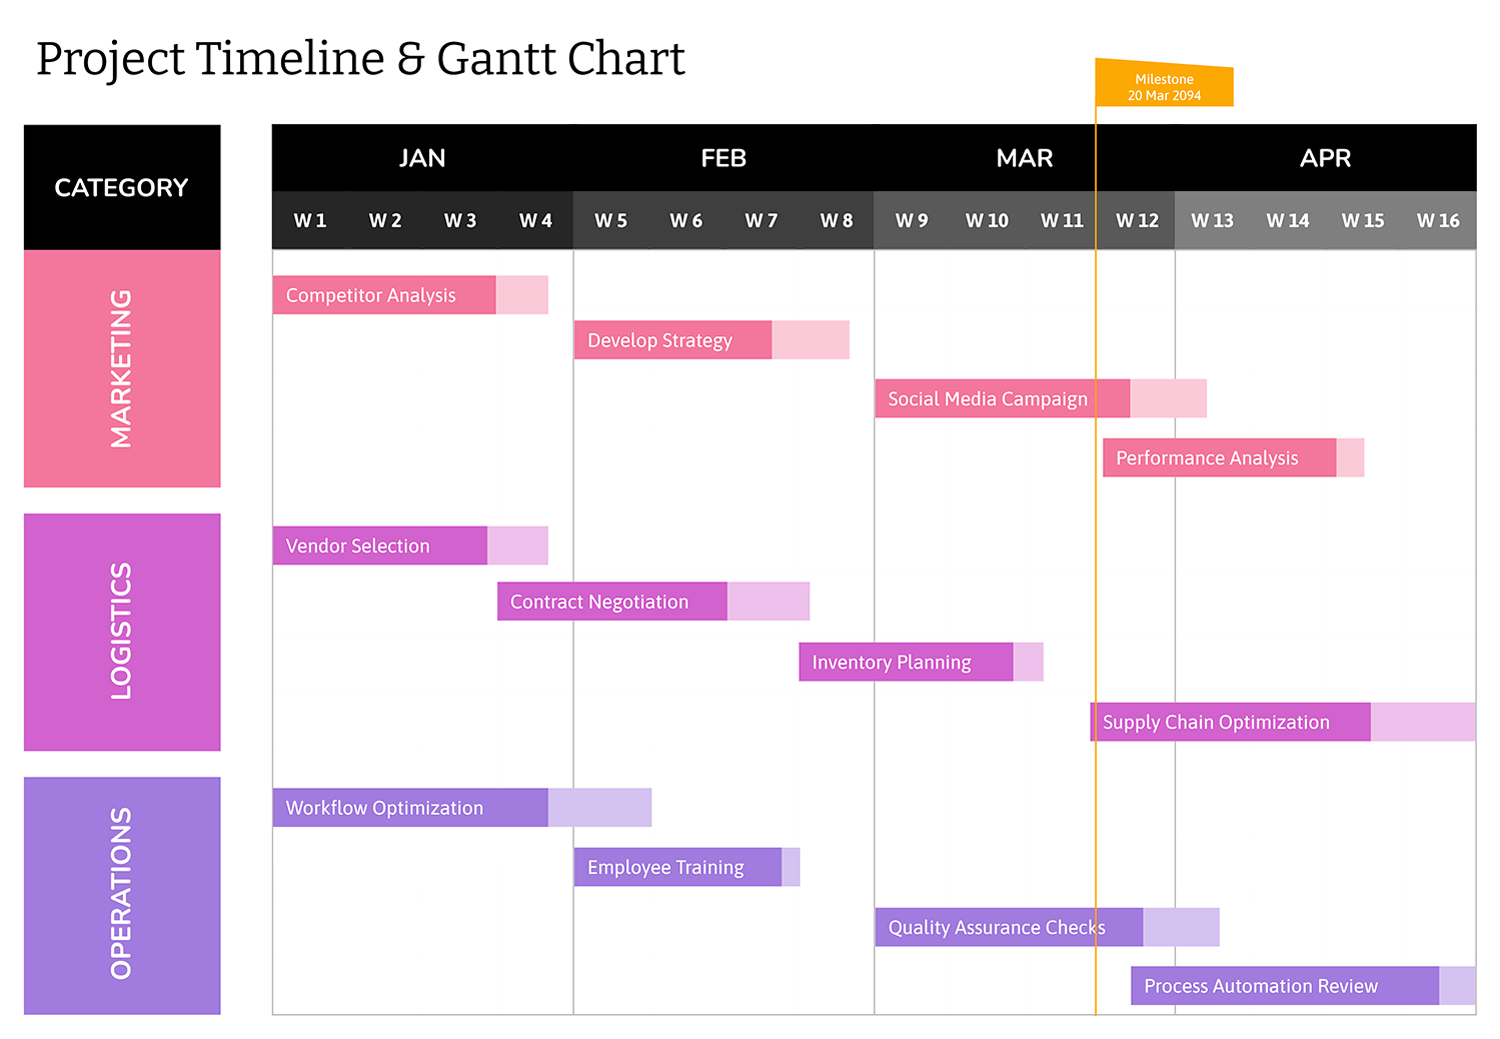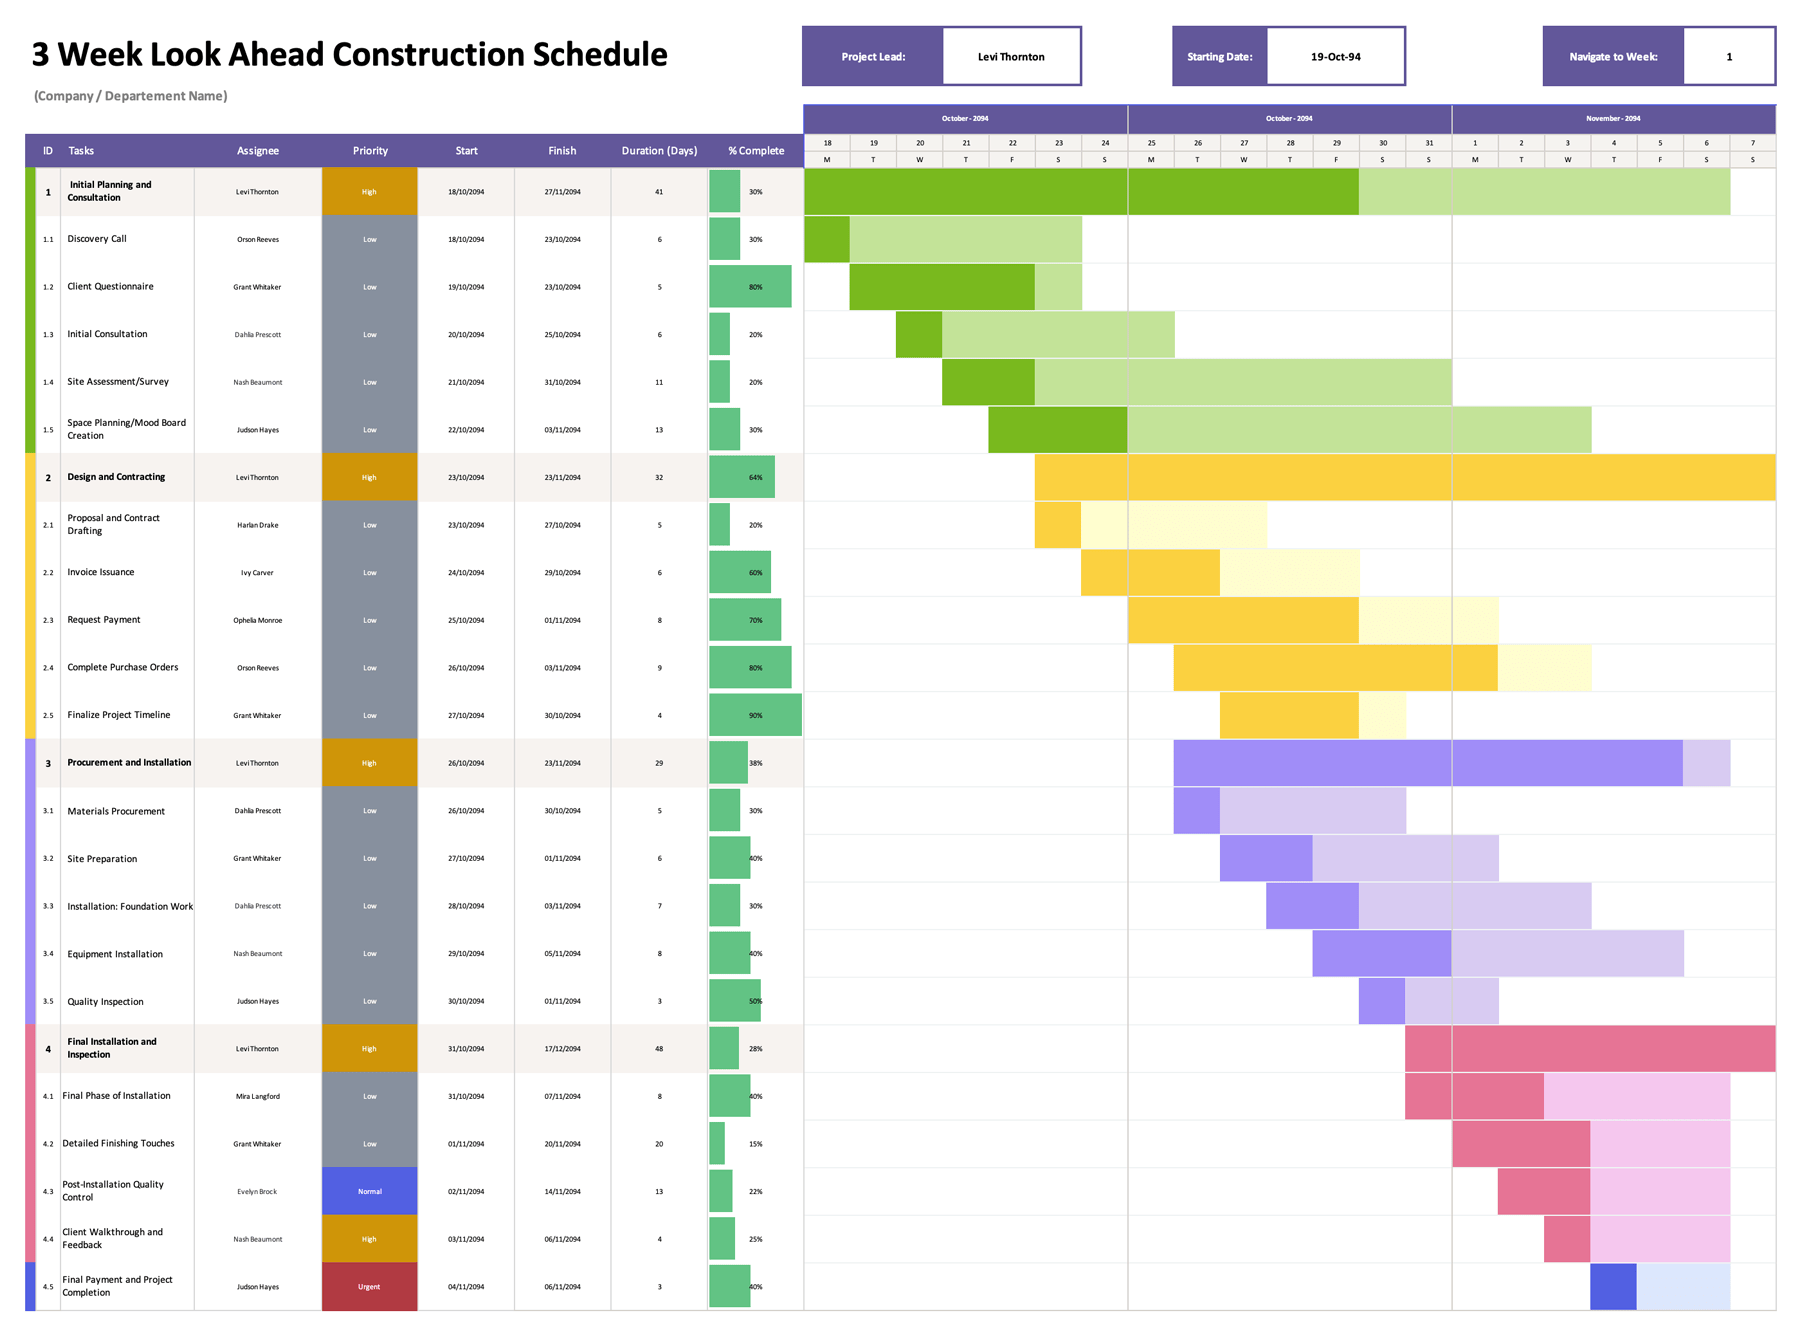

Event planning usually becomes a shifting timeline. A vendor confirmation arrives late, an approval gets delayed, or one task takes longer than expected, and the rest of the schedule needs to move with it. A Gantt chart keeps the plan tied to real dates so changes are easier to understand and easier to communicate.
This Event Planning Gantt Chart Template is built in Excel and Google Sheets for planning multi-step events such as conferences, corporate gatherings, weddings, fundraisers, launches, and community programs. It organizes work into phases and task rows, then places each task across a day-by-day timeline based on the start and end dates you enter.
As the schedule changes, you update dates, progress, and status in the task table, and the timeline reflects the latest plan. The sections below explain how to fill it in and keep it updated through the full planning cycle.
Here’s a breakdown of the template so you can set it up, keep it updated, and use it throughout the planning cycle.
Set the Event Name and Planning Window
Start at the top of the sheet and enter the event name. Next, set the planning window using the start date shown in the header area. The date row across the top of the chart is built from that start date and moves forward one day per column, with a second header row showing the day-of-week initials. In the current layout, the timeline displays a 35-day range.
Name Each Phase So the Plan Matches How You Run the Event
Each phase row is labeled “Phase Title” and acts as a divider for a major part of the event plan. Rename these phases to match how you assign work. For example, you might separate venue and logistics from programming, marketing, sponsorships, and staffing.
Phase rows are also useful for accountability. If one group owns an entire work stream, you can keep their tasks grouped under that phase and review that portion during team check-ins.
Enter Tasks and Assign an Owner in the Response Column
Under each phase, fill in the task rows. Use the task name field for an action-based label that reads like a work item, such as “Sign venue contract” or “Confirm speaker travel.” Then assign ownership in the Response column. Many teams use a person’s name, but you can also use a role, vendor name, or department if that matches how assignments are handled.
The checkbox cell on each task row can be used as a simple completion marker. In Excel, it may already be tied to TRUE or FALSE values. In Google Sheets, you can convert those cells into checkbox format so updates stay quick during reviews.
Use task names that describe a finished result, not a general topic. That makes status updates faster because the owner can answer one question, which is “Is this done or not done yet.”
Add Start and End Dates to Place Each Task on the Timeline
For each task row, enter a start date and an end date. The Gantt timeline section uses those dates to show a bar across the matching days. This is the part of the template you will reference most during planning meetings because it shows overlaps, gaps, and timing pressure across phases.
If a task bar does not appear where you expect, check two things first. Confirm the task dates fall within the visible header range, then confirm the start date is not after the end date.
Use Duration for Workday Estimates
The Duration column calculates the length of a task in workdays using a weekday-based count. This is useful for estimating effort, assigning follow-ups, and spotting tasks that look short on the calendar but take more working time once weekends are excluded.
If you want duration to represent calendar days instead of workdays, replace the duration formula with a calendar-day calculation for your version of the sheet. That change affects the duration number, while the timeline still reflects the dates you enter.
Track Progress as a Percentage
Use the Progress column to record how far along a task is. This works best when you update it in small increments during the planning cycle, especially for tasks that take multiple days such as outreach, vendor sourcing, design drafts, or ticketing setup.
A simple internal rule can make updates easier. Use progress for “how far,” and use status for “what state it is in.”
Set Status Using the Dropdown
The Status column uses a dropdown list so every task follows the same status language. This makes reviews quicker because you can scan for items that require attention.
You can use the four status options like this.
- In Progress for active work that is moving forward
- On Hold for items waiting on approval, assets, or a dependency
- Delayed for tasks that are past the intended timing or likely to push the next step
- Completed for finished work that no longer needs scheduling attention
If you mark a task as Delayed, update the end date in the same review. That keeps the timeline aligned with reality and prevents later tasks from looking available when they are not.
Update the Schedule During Check-Ins
During planning reviews, you will typically adjust three things. Ownership when responsibilities shift, dates when dependencies change, and status when work pauses or finishes. After those updates, scan the timeline for new overlaps and compressed weeks. This is where the template earns its value, especially in the final stretch where many tasks cluster close to the event date.
Wrap-Up
This template is available in Excel and Google Sheets versions, so you can manage it offline in Excel or collaborate in Google Sheets during planning cycles. The status dropdown carries over well between platforms, and checkbox-style task tracking can be kept using TRUE or FALSE values or converted into checkbox formatting in Sheets. For sharing and printing, the layout is usually easiest to read in landscape with scaling set so the full timeline prints across the page.
FAQs
Yes. Copy an existing task row from the same phase and paste it into a new row within that phase block so the formatting and timeline behavior carry over. After that, update the task ID, task name, owner, and dates.
The bar may not show fully or may not show at all if the date falls outside the header range. Adjust the chart start date to bring the planning window into view, or extend the date columns to cover a longer range.