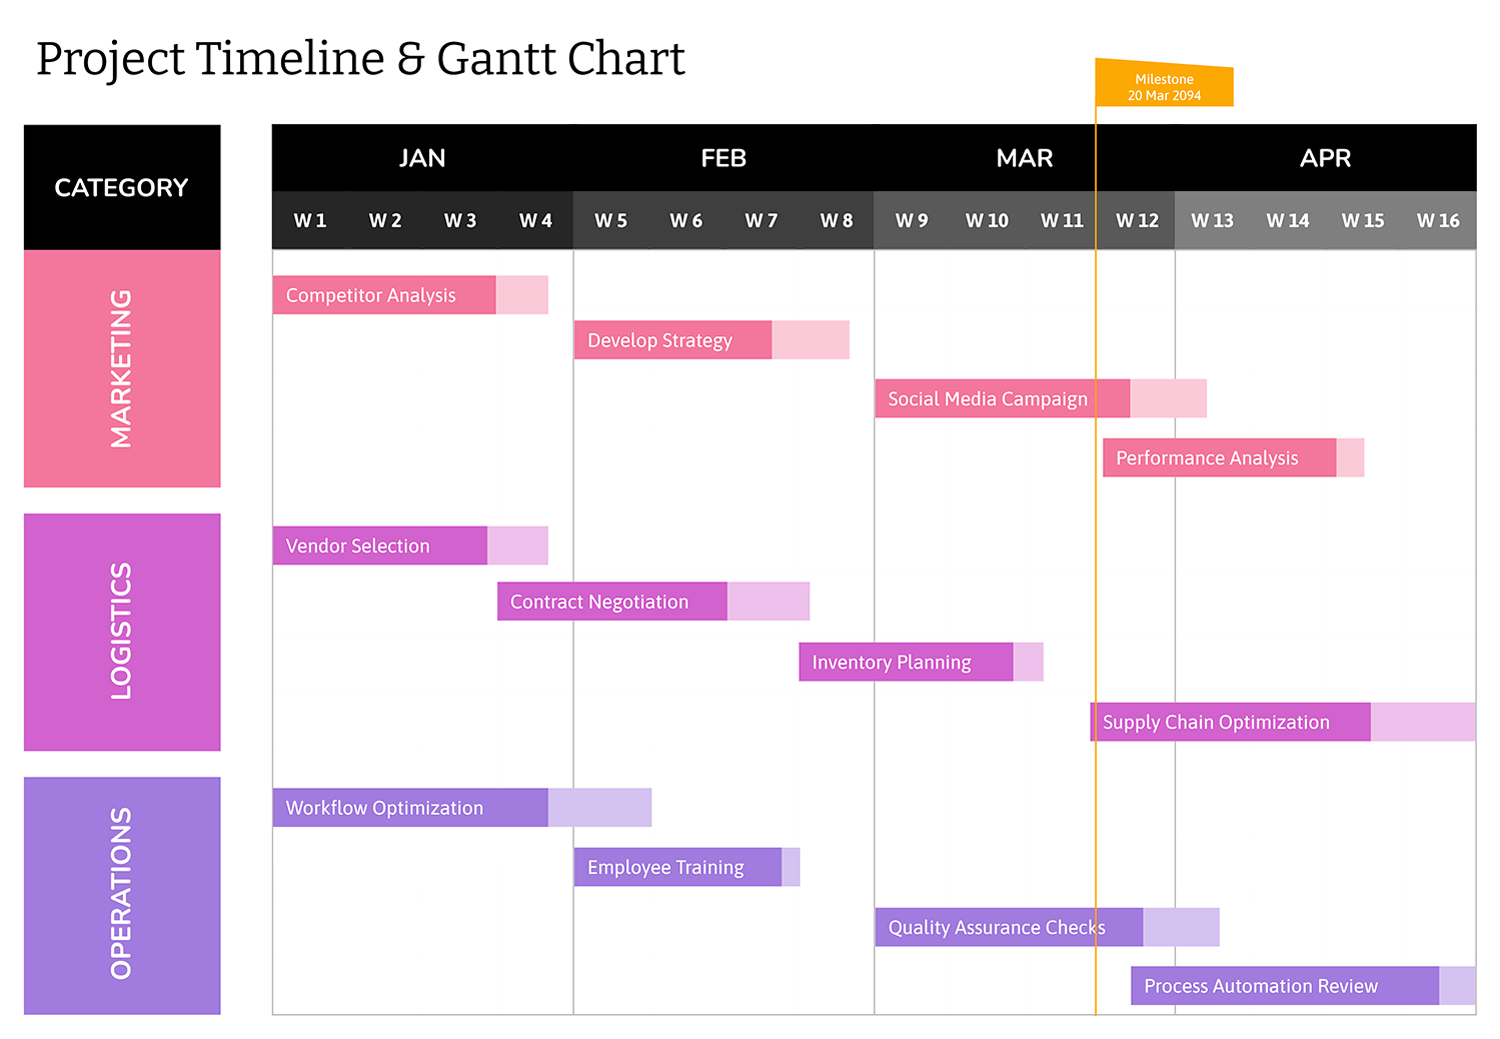
Gantt charts turn a task list into a date-based schedule so you can review timing, overlaps, and deadlines across a project. This Gantt Chart with Milestones Template is a spreadsheet designed in Excel and Google Sheets for planning work in phases while also highlighting milestone checkpoints such as approvals, sign-offs, handoffs, and delivery dates. When you mark an item as a milestone, the timeline displays a red diamond marker on the start date so the checkpoint is visually prominent during reviews.
Here is what you can manage in this file.
- Phases and Task IDs You can group work under phase headers and keep task numbering easy to reference in meetings.
- Owners and Priority You can assign responsibility and flag urgency using High, Normal, and Low priority labels.
- Dates and Duration You can place each task on the timeline using a start date and duration in days.
- Progress and Status You can log completion percentage and apply status labels such as In Progress, On Hold, Delayed, Completed, or Milestone.
Project Header and Timeline Setup
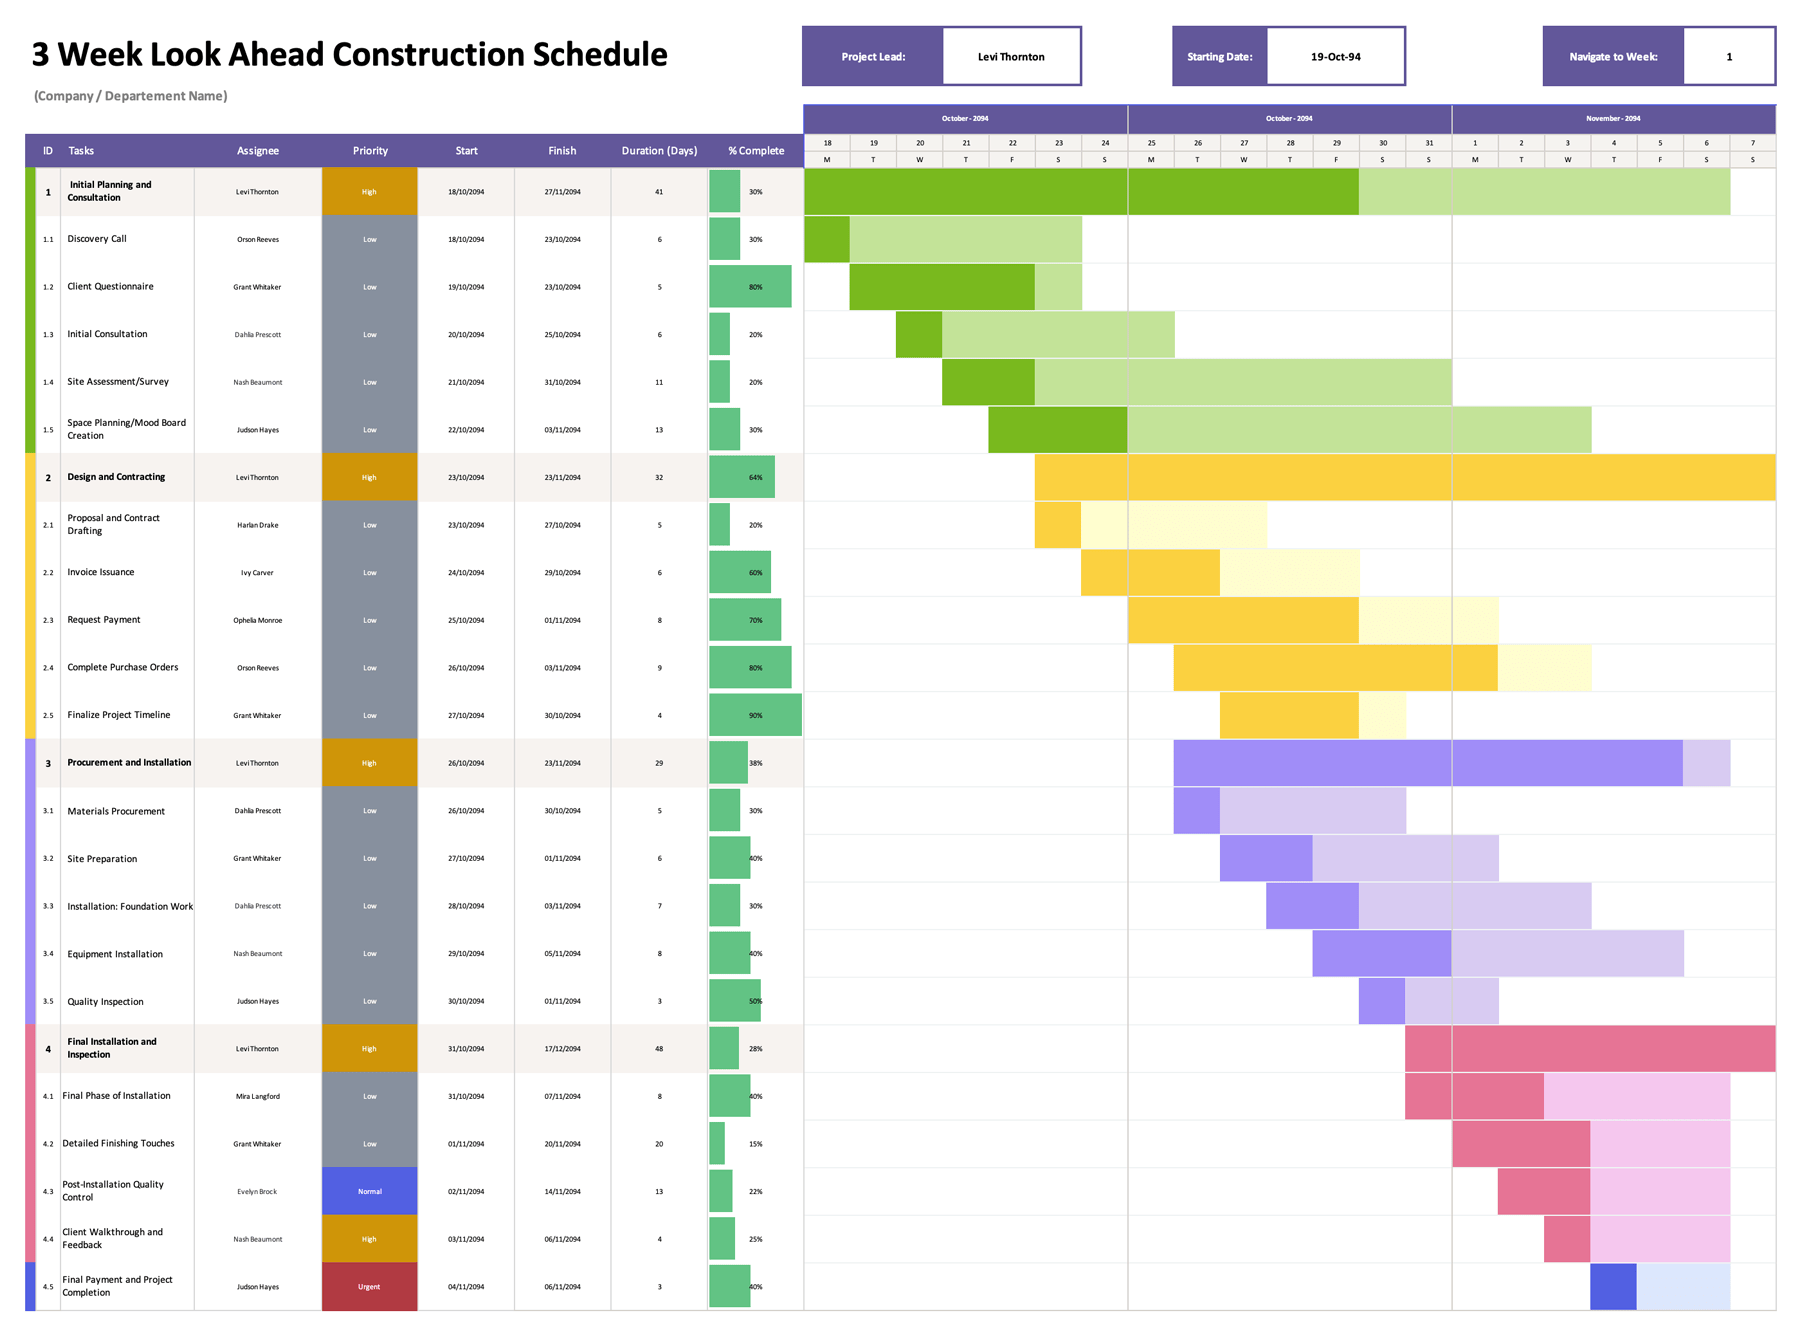
The header section includes fields for project title, company name, project manager, and start date. The start date drives the timeline header, which lists daily columns and also shows weekly date labels above the day grid. If you want the chart to begin on a different day, update the start date and the calendar shifts to match.
If a task start date falls outside the visible date range, the bar will not appear where you expect. In that case, either adjust the project start date or extend the timeline columns to cover the full project period.
Phase Blocks and Task Entry
The left side of the sheet is your task table. Each phase begins with a phase title row, followed by task rows that include task ID, task name, priority, assignee, start date, duration in days, and progress.
A practical setup approach is to enter phase titles first, then add tasks under each phase in the order you plan to execute them. If you need more rows, copy an existing task row inside the same phase block and paste it below, then overwrite the text and date fields. This keeps the timeline formulas aligned with the calendar columns.
How the Gantt Bars Are Plotted
Each task uses two inputs to place it on the chart.
You enter a start date, then enter the duration in days. The gantt area highlights the dates from the start day through the duration window. Phases are visually separated in the chart area so blocks are easier to scan during planning and status meetings.
If you change a task’s start date or duration, the highlighted bar updates to match the new window.
Making Milestones Visually Prominent
Milestones are handled through the Status column. When you set a task’s status to Milestone, the timeline adds a red diamond marker on the task’s start date. This is useful for checkpoints that must be noticed quickly, such as a client approval, internal sign-off, release date, or a delivery handoff.
If you want a milestone marker at the end of a task or at the end of a phase, add a separate milestone row with a one-day duration and set the start date to the checkpoint day. This keeps the milestone marker tied to the exact date you want reviewed.
Progress, Priority, and Status Tracking
The Progress column is formatted as a percentage and shows a visual progress bar. You can type values like 25%, 60%, or 100% and update them as work moves forward. This gives you a fast way to spot tasks that are started but not finished, especially when a milestone date is close.
Priority and status labels are also color-coded. Priority gives you a quick urgency indicator, while status labels distinguish active work from delays, pauses, completed items, and milestone checkpoints. If your team uses different wording, you can update the label list on the Status sheet and keep internal reporting language aligned with your process.
Extending the Date Range for Longer Projects
The template begins with a preset timeline range. If your plan covers more days than the current range, extend the date columns to the right so additional days appear. After extending, review the week labels at the top to confirm the weekly breakpoints still line up with the daily columns.
For shorter projects, you can keep the default range and focus on the part of the schedule that matters for the current reporting period.
Review, Sharing, and Printing
This template works well for weekly check-ins where you want to review what is planned, what is delayed, and which milestones are next. To keep updates reliable, decide who updates progress and status and how often those fields are refreshed.
If you plan to print or export, set the print area to include the task table and the date window you want to show. For stakeholder updates, it often works best to share a view that includes the upcoming milestone period plus the tasks that feed into it.
FAQs
Enter the milestone item as its own row, set the start date to the checkpoint day, set duration to 1 day, then set Status to Milestone. The red diamond marker will appear on that date in the timeline.
Yes. Setting Status to Milestone adds the red diamond marker on the task start date. If you want a milestone marker on a different day inside that task window, add a separate milestone row for that date.
Create two milestone rows. Set one to the phase start checkpoint date and the other to the phase end checkpoint date. Keep each as a one-day duration so the markers represent fixed checkpoints.
Enter a percentage value such as 10%, 50%, or 100%. The cell formatting displays it as a percent and the progress bar updates to match.
Extend the date columns to the right so additional days appear. After that, confirm your project start date remains correct and that the task bars fall within the visible date range.
Yes. Update the lists on the Status sheet, then use those updated labels in the Priority and Status columns. Keep labels consistent across the team so reporting stays readable.