A construction Gantt chart is used to plan and review project timelines by placing tasks against real calendar dates. This Gantt chart template is designed for construction projects that need a clear schedule showing when each phase starts, how long it is expected to take, and how tasks relate to one another over the course of the project. The chart focuses on practical scheduling rather than visual decoration, making it suitable for planning, internal coordination, and client facing summaries.
The construction Gantt chart template is built around date-based logic to manage timelines as conditions change during construction. Tasks can be adjusted as materials arrive earlier or later than expected, inspections are rescheduled, or work phases overlap. It is intended for residential builds, commercial construction, renovations, and multi-stage projects where visibility into timing matters more than complex dependency modeling.
How to Use This Construction Project Gantt Chart Template
Start by treating the Gantt chart as a planning reference that evolves with the project. Enter initial dates to establish sequencing, then refine the schedule as details become firm.
Enter Project Information
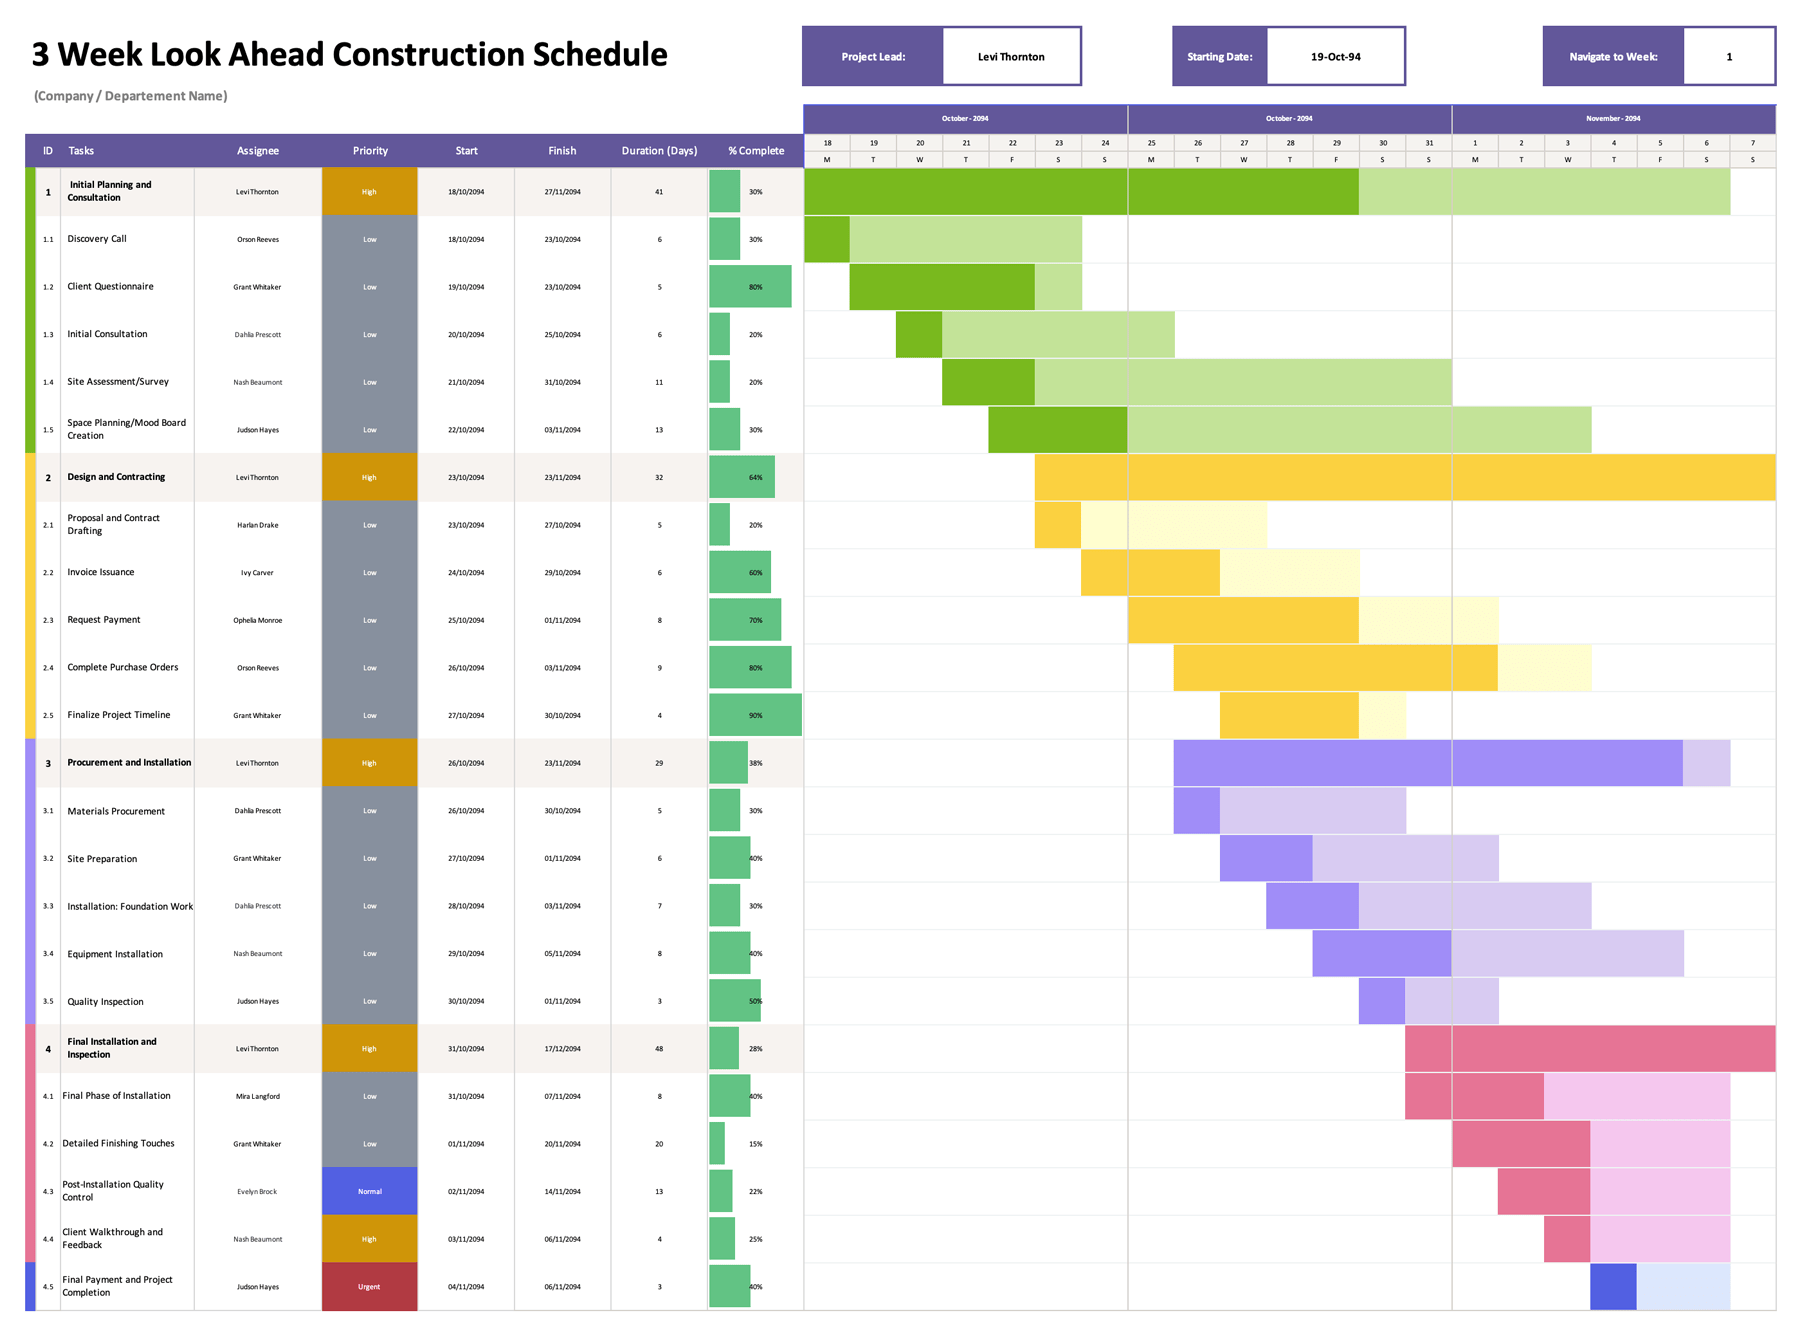
At the top of the template, add the project name, project lead, location, and the overall start and end dates. This section is meant to clearly identify the schedule when it is printed, shared digitally, or stored alongside other project documents.
Define Construction Tasks
List tasks in the order they are expected to occur. Task names should reflect actual construction phases or trade activities so the schedule matches how the project is managed on site. Examples include clearing, framing, plumbing, wiring, roofing, finishes, and inspections.
For better control, tasks can be broken into smaller segments that reflect approvals or handoffs. Splitting a large phase into smaller items can make schedule adjustments easier when part of the work shifts.
Set Start and Due Dates
Enter a start date and due date for each task. In Excel and Google Sheets, the duration field calculates automatically based on these dates, and the Gantt area updates to show the task timeline. When dates change, the duration and visual bar update without manual adjustments.
Spreadsheet duration calculations are based on date differences. If your team treats both the start and end date as full working days, review durations so expectations remain aligned with on site planning.
Review The Timeline View
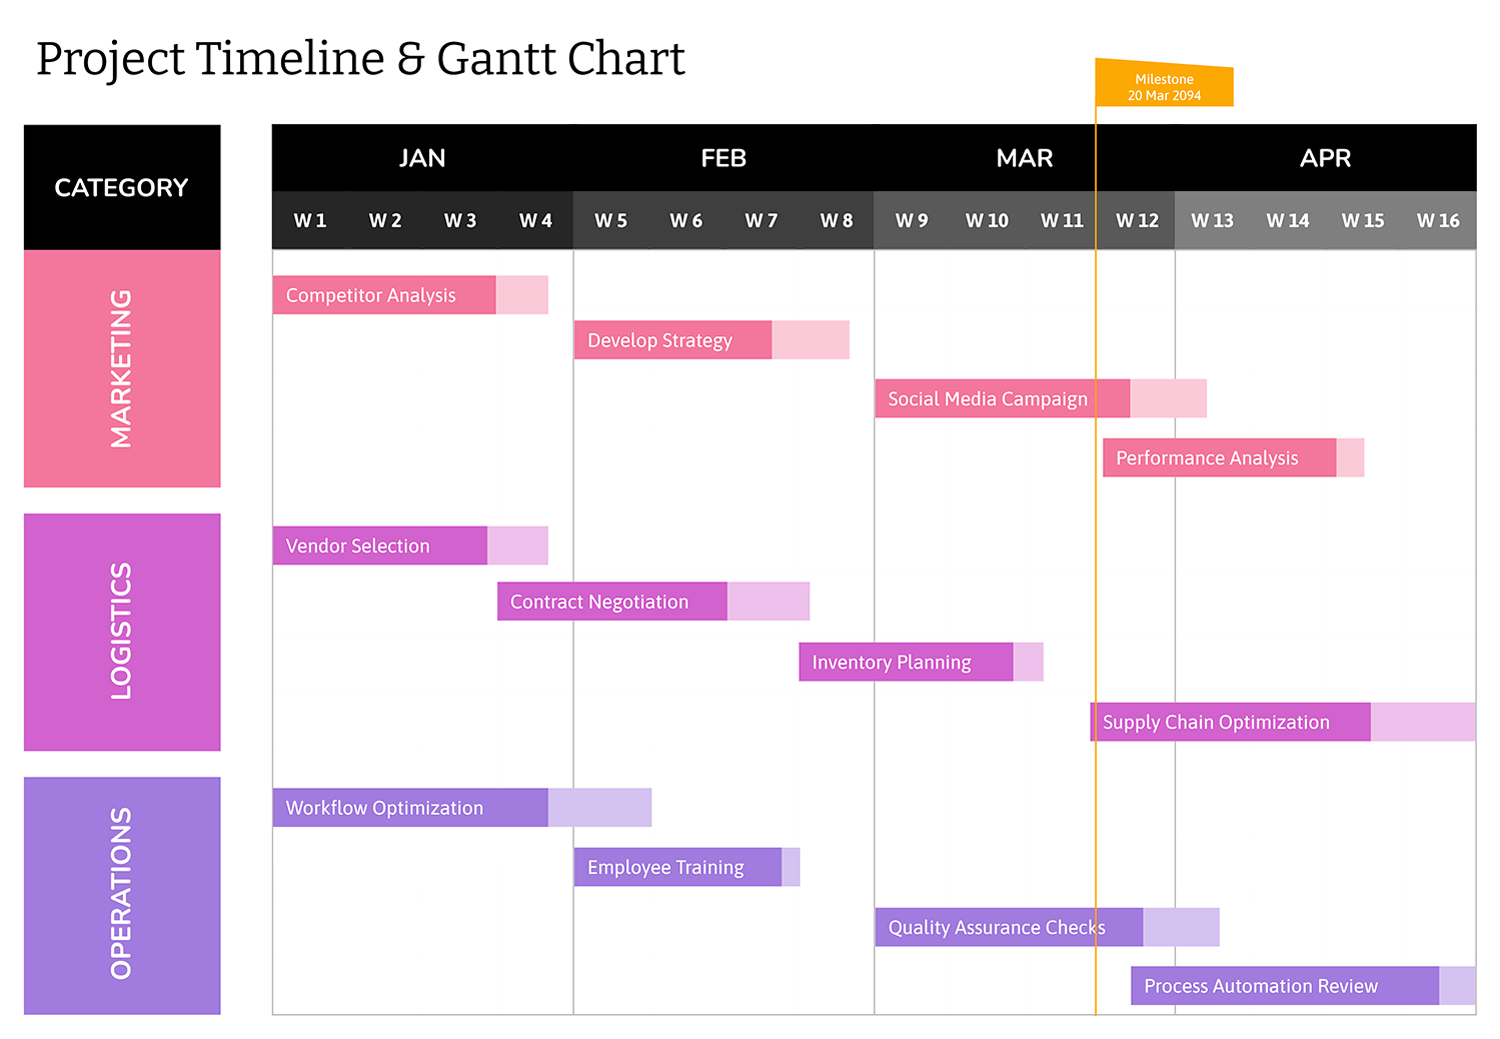
The timeline section displays months across the top, with date blocks forming the Gantt chart. When a task’s dates fall within the timeline range, the corresponding cells are shaded. This view is intended for reviewing sequencing, overlaps between trades, and overall project pacing.
Use this section during coordination meetings or planning reviews to quickly identify conflicts or unrealistic overlaps.
Update The Schedule as Conditions Change
Construction timelines often shift due to weather, inspections, material delays, or scope changes. When this happens, adjust the affected task dates first, then review any downstream tasks that depend on that work. This keeps the schedule realistic and aligned with actual site conditions.
When adjusting dates, start with tasks that affect others directly. Updating dependent tasks first reduces the risk of hidden schedule conflicts later.
Expand or Group Tasks When Needed
If additional tasks are required, insert new rows within the task area so formatting stays intact. Phase headers such as “Site Work” or “Interior Finishes” can be added as visual separators, with dates left blank so they function as labels rather than scheduled items.
File Format and Editing
This Gantt chart template is available in Excel, Google Sheets, PowerPoint, and Google Slides. The Excel and Google Sheets versions use date calculations and conditional formatting to update durations and the Gantt timeline automatically. The PowerPoint and Google Slides versions are intended for manual editing and printing when spreadsheet logic is not required.
FAQs
This typically occurs if the start date is later than the due date, the dates fall outside the timeline range, or the cells are not formatted as dates. Correcting these issues usually restores the timeline bar.
Yes. Each task is entered independently. If multiple tasks share overlapping date ranges, the Gantt chart displays those overlaps across rows, which is useful for identifying coordination points between trades.
Update the timeline reference dates so the month and date range match the project year, then adjust task dates accordingly. After changing the timeline, confirm that the shading still responds to date entries.