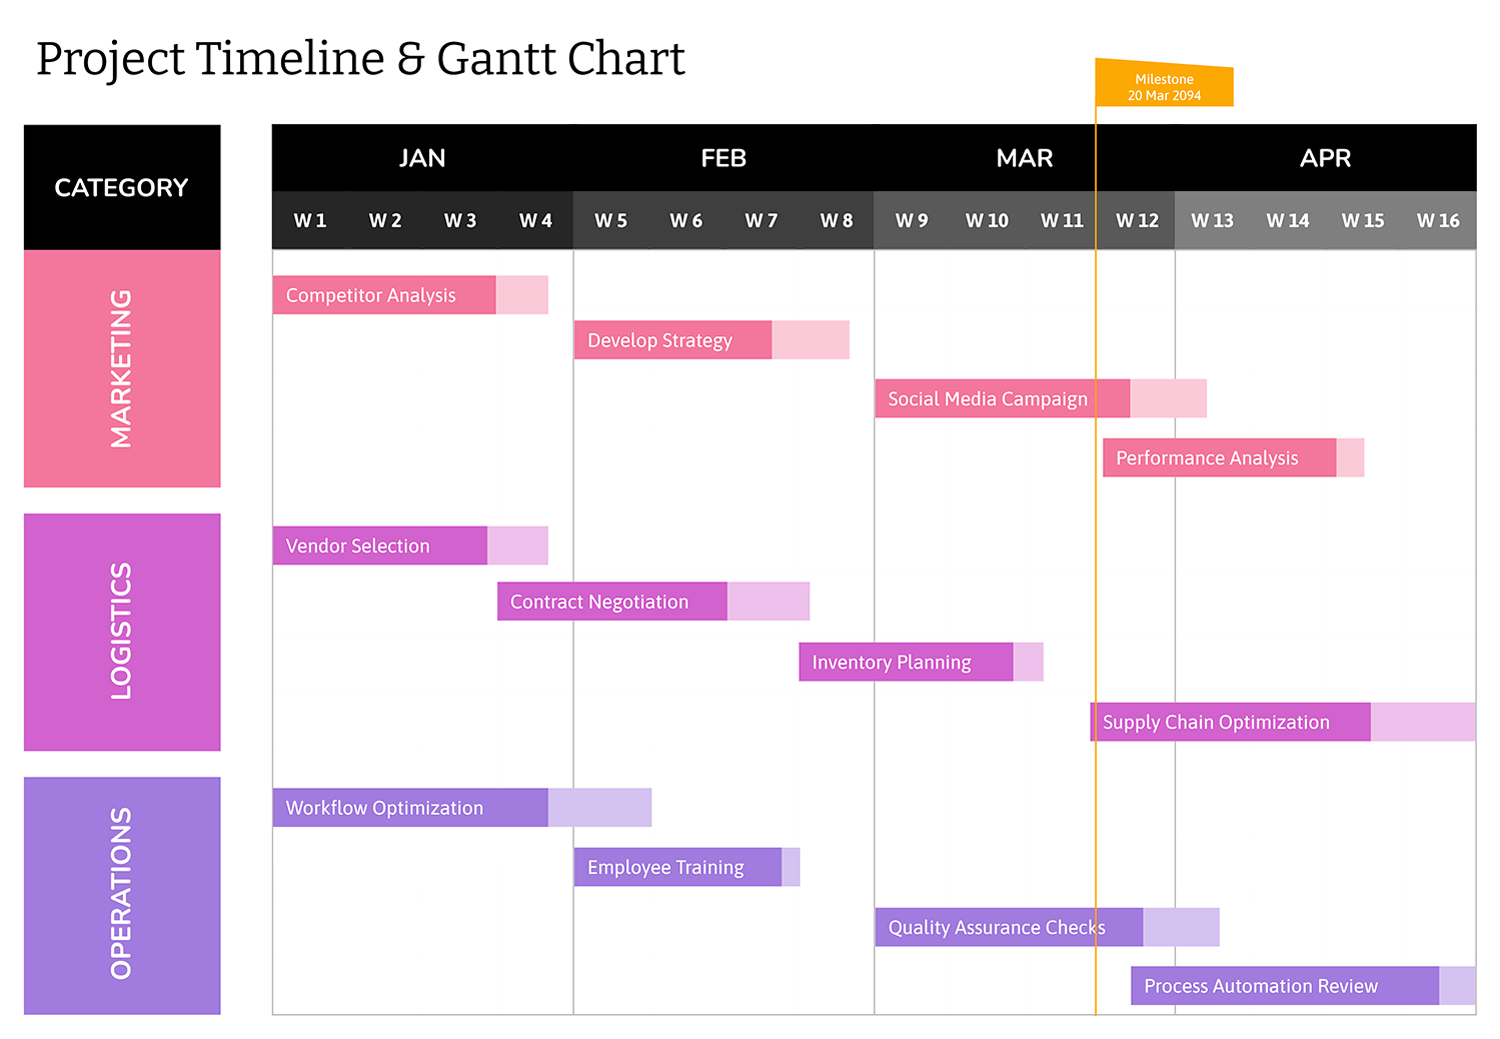
This template is designed for project managers, business analysts, and teams that oversee long-term projects to track progress across different stages. It is particularly useful in corporate planning, product development, and research initiatives where tasks span multiple months and need clear visualization.
This Gantt chart is formatted for four quarters, covering a complete year. Each task is assigned a timeline to track milestones, identify dependencies, and adjust timelines as needed. While it is designed for a full year, the month labels can be modified to reflect any custom time frame.
Every element in this chart, including headings, shapes, labels, and colors, can be adjusted in Google Docs and Word.