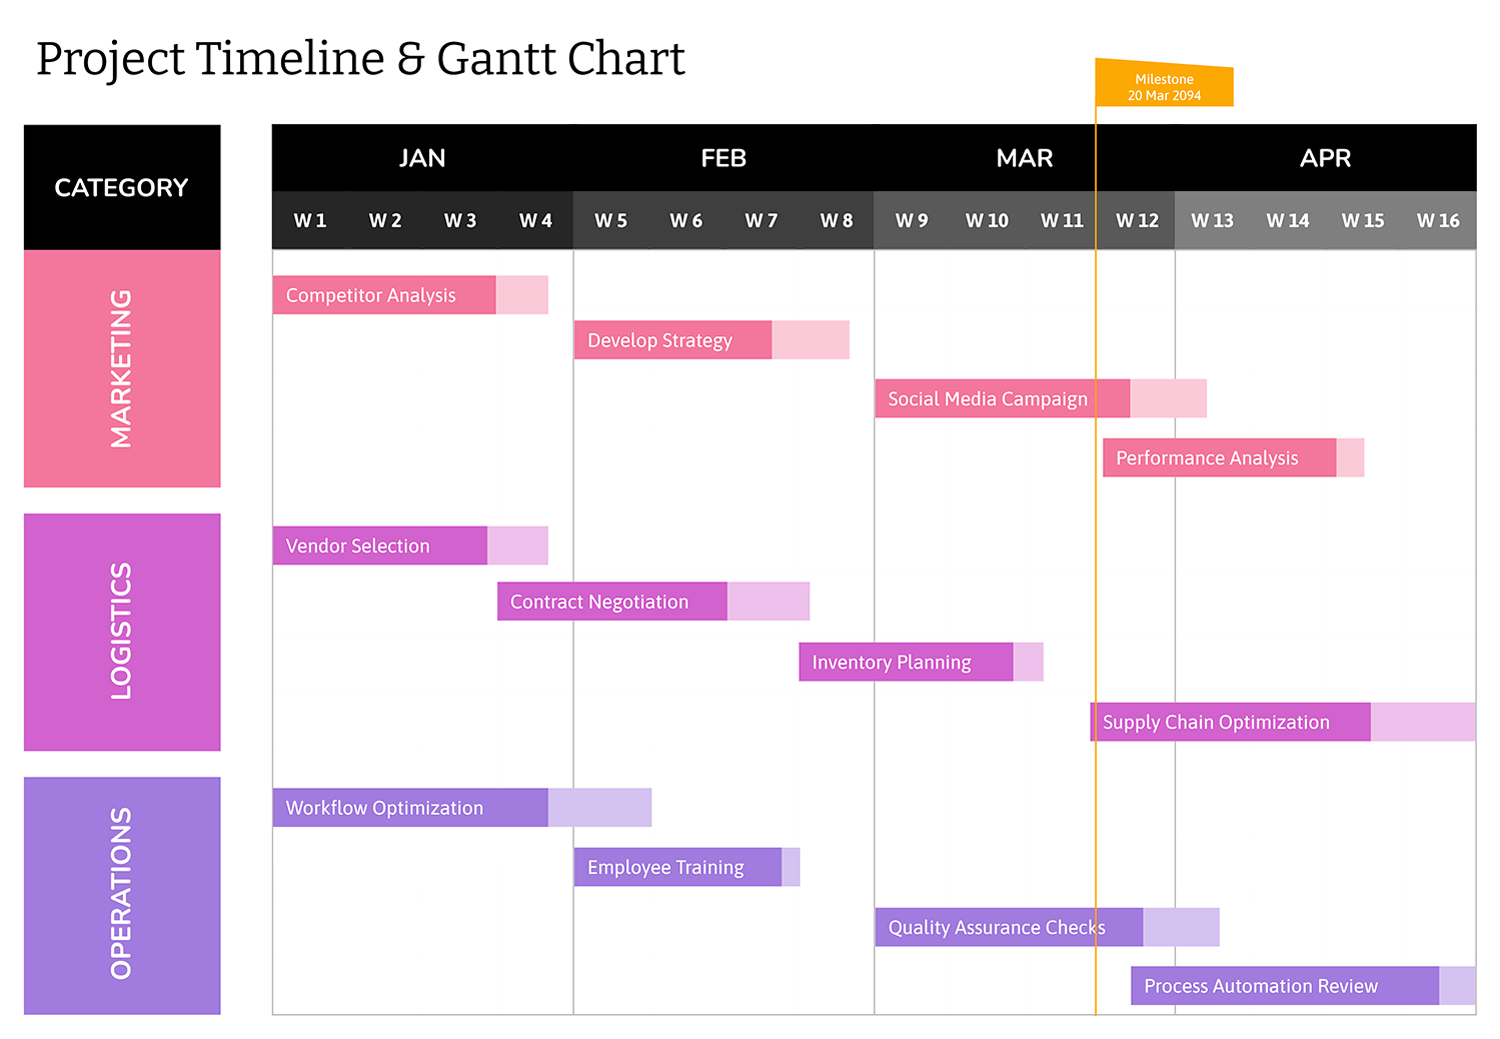
A construction schedule becomes easier to manage when everyone can see the same timeline and the same phase boundaries. This construction Gantt chart template gives you a year view that shows when major phases start and finish, how long each phase stays active, and where work overlaps across months. It is designed for planning and progress updates where month-level visibility is the main requirement, such as residential builds, commercial fit-outs, remodels, site work, and multi-trade coordination.
You can enter phase rows and task rows on the left, then add start dates and due dates for each line. The 12-month grid on the right shades the months covered by those dates, so you can see where work overlaps and how long each block stays active. Here’s a quick breakdown of the construction Gantt chart to understand it better.
How to Fill Out and Customize This Construction Gantt Chart
Before you start adding many rows, set the project header and confirm the timeline year. After that, you can build the schedule in a quick first pass with phase dates, then refine it by adding detailed task lines under each phase.
Add Project Details in the Header
Enter the project name and department in the top-right header area. This is useful when the file is shared across a team or saved alongside other schedules.
Confirm the Timeline Year
The month grid is tied to the year set in the sheet. If you are planning for a different year, update the timeline year first so the month shading matches the dates you will enter.
If the month shading looks off after you enter dates, check that the timeline year matches your start and due dates.
Build Your Phase List First
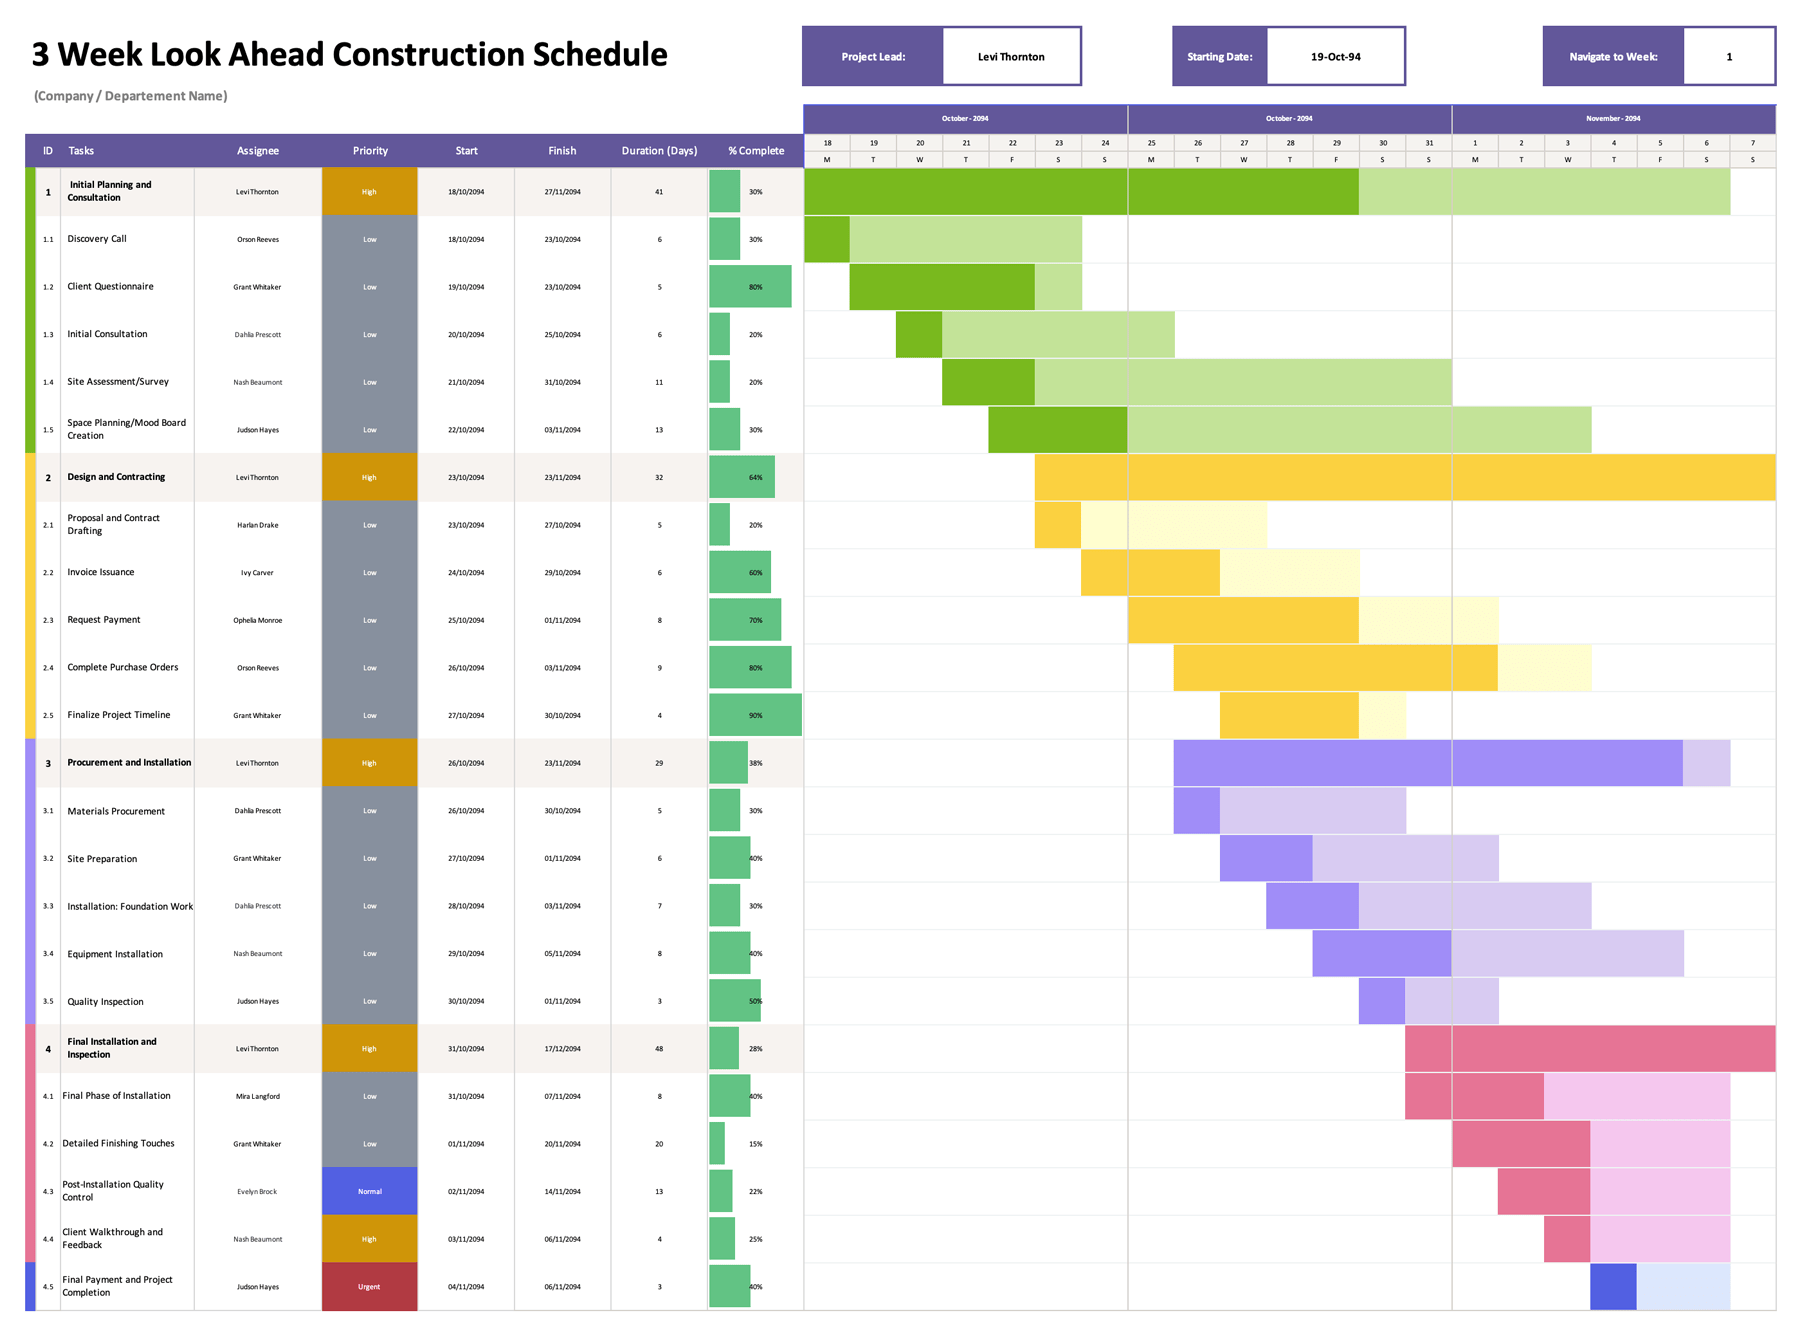
Use the ID column to set your main phases. Whole numbers are used for phase rows, such as 1, 2, 3, 4. These rows are styled to stand out, which is useful for high-level planning discussions.
A good phase set for many projects includes site preparation, foundation work, structural build, MEP rough-in, finishes, inspections, and handover. Your phases may differ based on project type and permitting requirements.
Add Task Lines Under Each Phase
Add your detailed tasks under the phase row using decimal IDs, such as 1.1, 1.2, 2.1. This keeps each phase grouped and keeps the task list readable.
Keep task names action-based and specific. “Electrical rough-in” and “Inspection scheduling” are easier to review than broad labels that can hide scope.
Enter Start Date and Due Date
For each phase and task line, enter a start date and due date. The month grid shades the months covered by the date range. This gives you a quick view of overlap, long lead periods, and crowded months where multiple trades converge.
If a task lasts a few days, the month still shades. That is expected in a month-level Gantt chart, since the goal is timing and overlap across the year.
Use Duration as a Reference
Duration is a quick reference field for review and communication. You can write “3 days,” “2 weeks,” or “1 month” based on how you estimate the work. The timeline shading is driven by the dates, so date edits remain the main way to update the schedule.
Adjust The Visual Style If Needed
In Excel and Google Sheets, the shaded months are controlled by conditional formatting in the timeline grid. The template uses one shading style for phase rows and a second style for task rows, so the main blocks remain easy to spot while the detail stays visible underneath. If you want the chart to match your internal reporting colors, update the fill colors in those formatting rules, then confirm the month shading still changes when you edit start and due dates.
In PowerPoint and Google Slides, the timeline is filled by applying table cell colors. Keep the same color logic as the spreadsheet version so the phase blocks and task lines read the same way when you present the schedule.
Pick a simple color system and keep it stable across updates. One common method is to use a single strong color for phase rows, then use a lighter shade of the same color for task rows. If you want trade-based views, save a separate copy for each trade so the main schedule stays easy to review.
Add More Rows While Keeping Formatting Intact
If you need additional tasks, insert rows within the task list area and carry the same formatting down. This keeps the month grid aligned and keeps the shading behavior consistent across new lines.
FAQs
Yes. Add the trade or responsible party into the task name so it stays visible during reviews. A simple naming style keeps it readable, such as “Electrical, rough-in” or “Owner, finish selections.” If you prefer separate visibility, add a new column for Trade or Owner and keep task names clean.
This chart reads time at the month level. A short task still shades the month where it occurs so overlaps and sequence remain visible across the year. The exact timing stays in the start date and due date fields.
For Excel and Google Sheets, set the print area to include the task columns and the full 12-month grid, then use landscape orientation so month columns stay readable. For PowerPoint and Google Slides, use the same timeline layout and color logic so the phase blocks and task lines read the same way on a slide during stakeholder updates.