



This 1-year Gantt chart template is built for project managers, coordinators, and teams planning activities for a 12-month timeline. It combines detailed scheduling in Excel with a simplified visual version in PowerPoint. The Excel Gantt chart is designed with automated tracking—it uses formulas, conditional formatting, and dropdown selections to calculate durations, show task progress, assign tasks, and update a color-coded monthly timeline. It’s most suitable for projects that require ongoing updates, date logic, or dynamic visual breakdowns. The PowerPoint version is a simple static counterpart used for printed summaries or presentation slides.
How to Use (Excel Version)
The 1-year Excel Gantt chart is completely automated and designed to reflect the timeline based on the start date and entered durations. As you input task details, each row updates the visual timeline and marks the progress using built-in formulas and conditional formatting. Below is a breakdown of each section and how it works.
Project Details Section
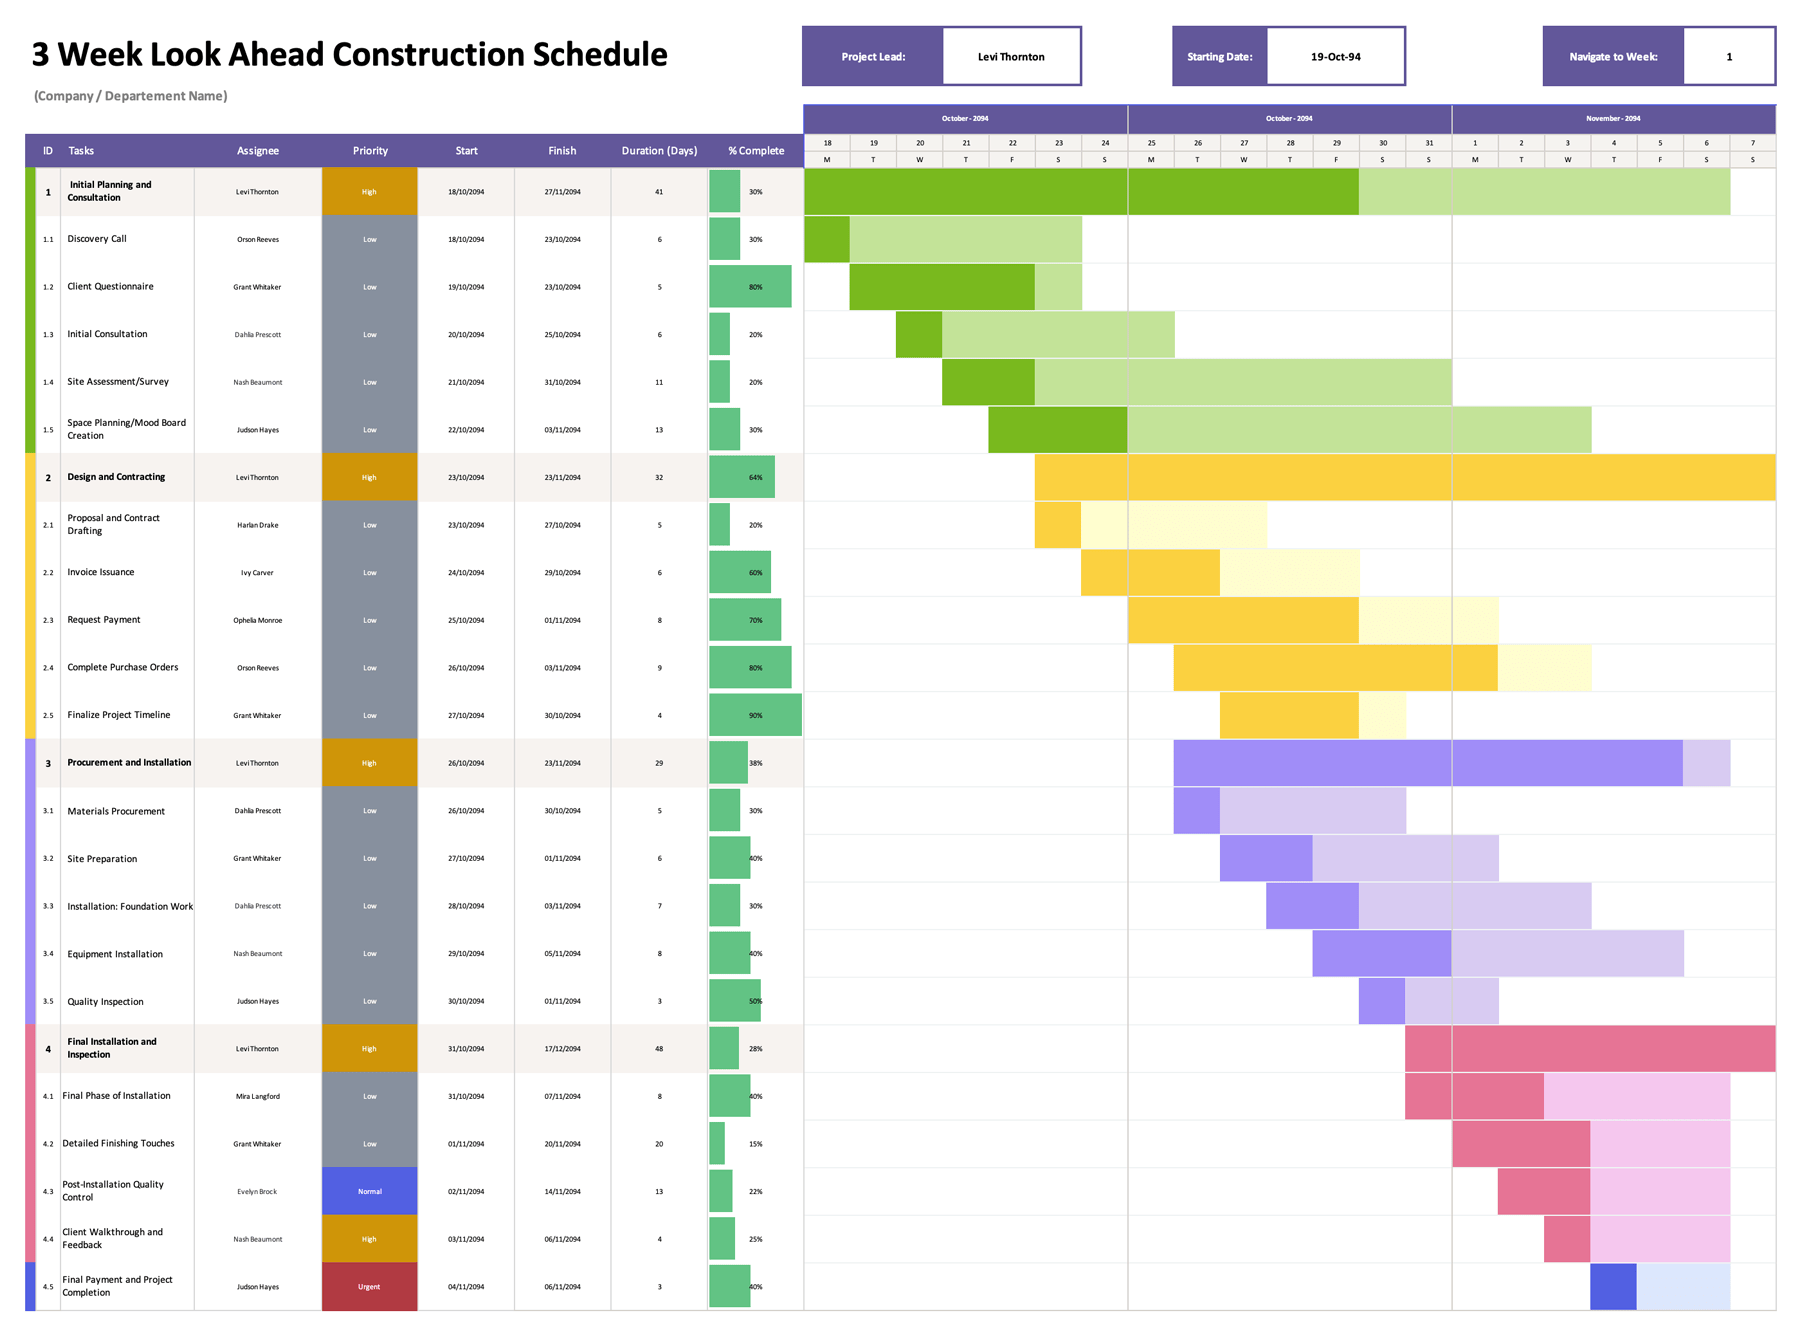
This section appears at the top of the sheet and includes fields for company name, project name, project lead, and starting date. The first three fields are used for reference and labeling purposes, especially when exporting or printing the timeline. The starting date field, however, controls the layout of the 12-month timeline grid—each monthly column adjusts automatically based on this input. Updating the start date will shift the entire visual timeline to begin from the selected month and year.
Task Table Overview
Each row in the table represents a specific task or activity. It includes fields for task ID, task name, assignee, start and finish dates, duration, progress, and status. Task IDs use a WBS format (e.g., 1.1, 2.3) to organize activities under broader phases. The Assignee column uses a dropdown list sourced from the Settings sheet, where you can define your project team members. Once defined in the Settings sheet, you can assign tasks by selecting the relevant team member from the list.
Before the ID column, there’s a dropdown for assigning a color code to each task. These codes (e.g., GR, BL, OR, BR) are linked to a color list defined in the Settings sheet. The selected code determines the color used to highlight the task’s timeline in the monthly grid. Conditional formatting uses these codes to apply consistent colors based on your selection. To customize, you can change the color codes in the Settings sheet and adjust the conditional formatting according to your new color and code.
Phase Titles and Grouping Tasks
Tasks can be grouped under broader phases to organize the timeline by milestones or work segments. Phase titles are entered directly into the task name column, with each phase assigned a main task ID (e.g., “01”, “02”, “03”). Tasks under each phase follow standard WBS formatting (e.g., “1.1”, “1.2”, “1.3”). Phase rows are visually separated using background colors to distinguish them from individual tasks.
To add a new phase, copy an existing phase row and its associated tasks, then paste them above or below the desired section. The pasted rows automatically retain all formulas and formatting. This grouping method is useful for segmenting projects into stages like planning, execution, and closure without interfering with timeline logic. If you prefer a simplified Gantt chart, you can delete the phase rows and change the task IDs to a flat sequence such as 1, 2, 3.
Start Date, End Date, and Duration
To schedule a task, enter the start date and duration. The end date is calculated automatically based on the selected duration type—either in days or months. You can switch between “Duration (Days)” and “Duration (Months)” using the dropdown in the table header. In day mode, the end date adds the number of days to the start date. In month mode, it uses full calendar months. The end date column is formula-driven and updates whenever the start or duration values change. To keep the timeline accurate, avoid editing the end date manually.
Monthly Timeline Grid
The timeline grid spans 12 months starting from the project’s defined start date. Each task’s active period is displayed across this grid using conditional formatting. There are two types of formatting applied: a lighter shade to indicate the full duration of the task and a darker shade layered of the same color layered on top to show progress based on the value in the “% Complete” column.
Timeline cells fill automatically based on the task’s start and end dates, while progress is calculated as a portion of that range. You can adjust the progress by entering the percentage value (e.g., 40%) in the “% Complete” column to reflect the current progress of each task.
Status Tracking
The “Status” column in the task table is used to label the current state of each task. It includes a dropdown menu with predefined options such as “In Progress,” “Paused,” and “Complete.” These labels are meant for review and communication purposes and can be used to filter tasks or organize views during team updates. These statuses are created through a data validation list and highlighted using conditional formatting.
How to Use (PowerPoint Version)
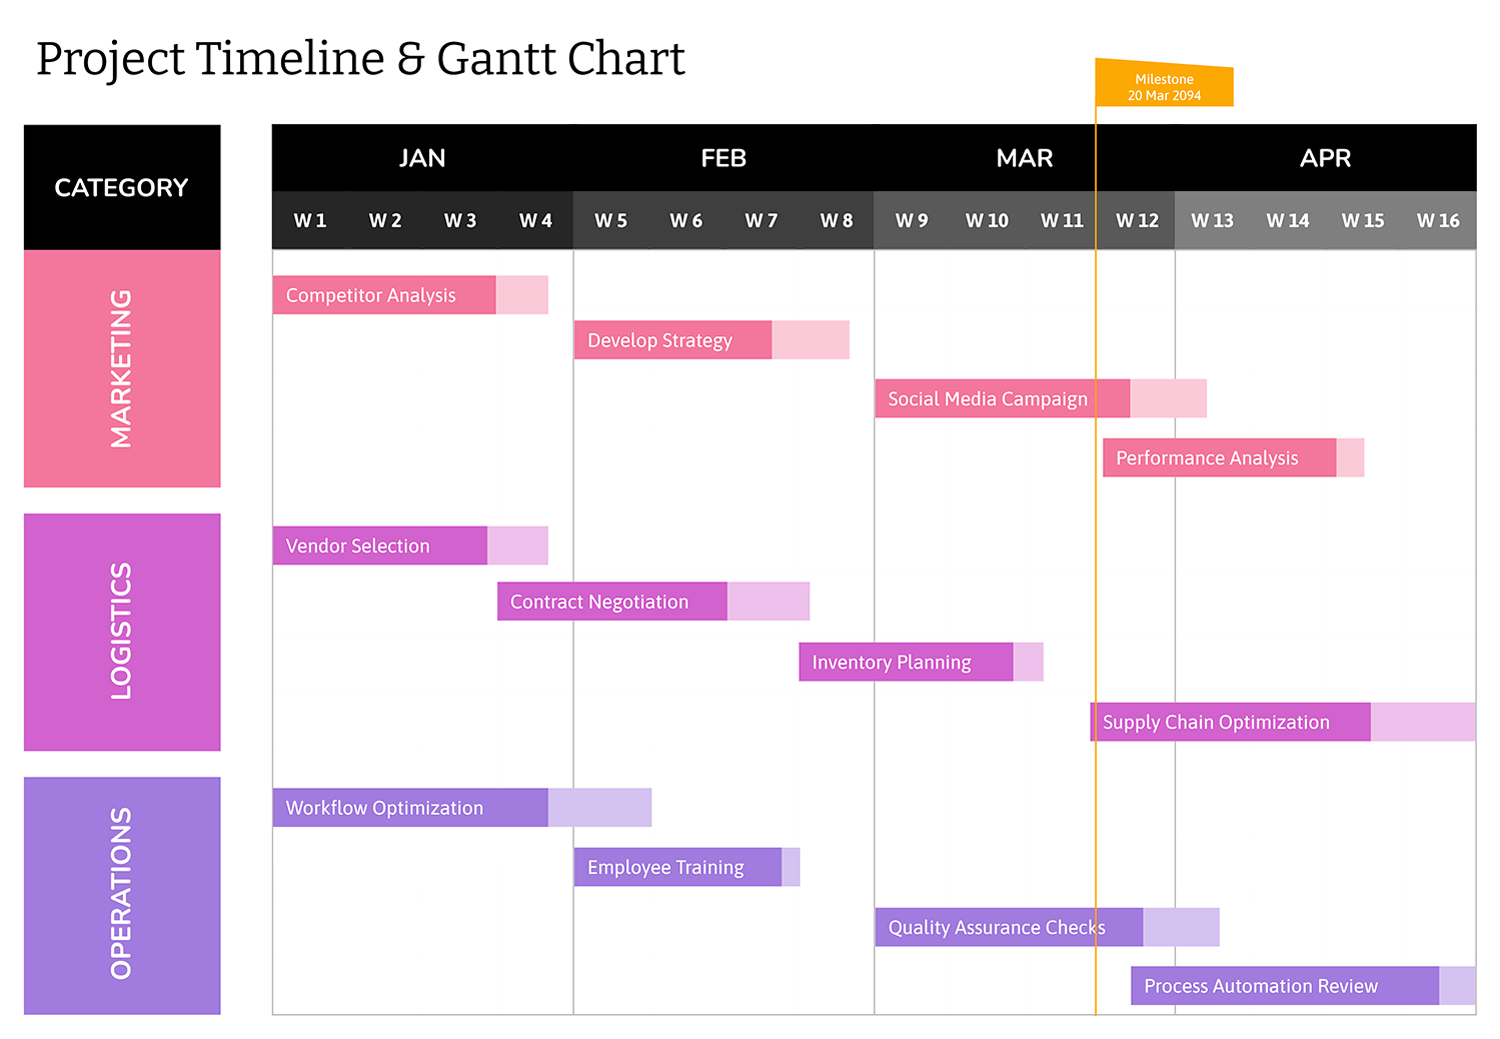
The PowerPoint version of this Gantt chart is a static layout designed for visual reporting. It mirrors the same 12-month timeline as the Excel version but does not include any formulas or automated calculations. Task names are placed on the left, and colored bars (shapes) are used to represent timelines manually within the monthly columns.
To use it, replace the placeholder text with your actual task names and adjust the colored bars to reflect the task’s planned duration. You can change the color, length, or placement of each bar by dragging and resizing the shape. This format is designed for simpler uses such as project summaries, stakeholder updates, or printed timelines where you don’t need live date tracking.
The one-year Gantt chart template is available in Excel, PowerPoint, Google Sheets, and Google Slides. When editing the Excel or Google Sheets version, avoid removing formulas or writing directly in the Finish (End Date) and timeline header columns to preserve the automated layout. For more relevant templates, you can explore the Gantt chart collection.