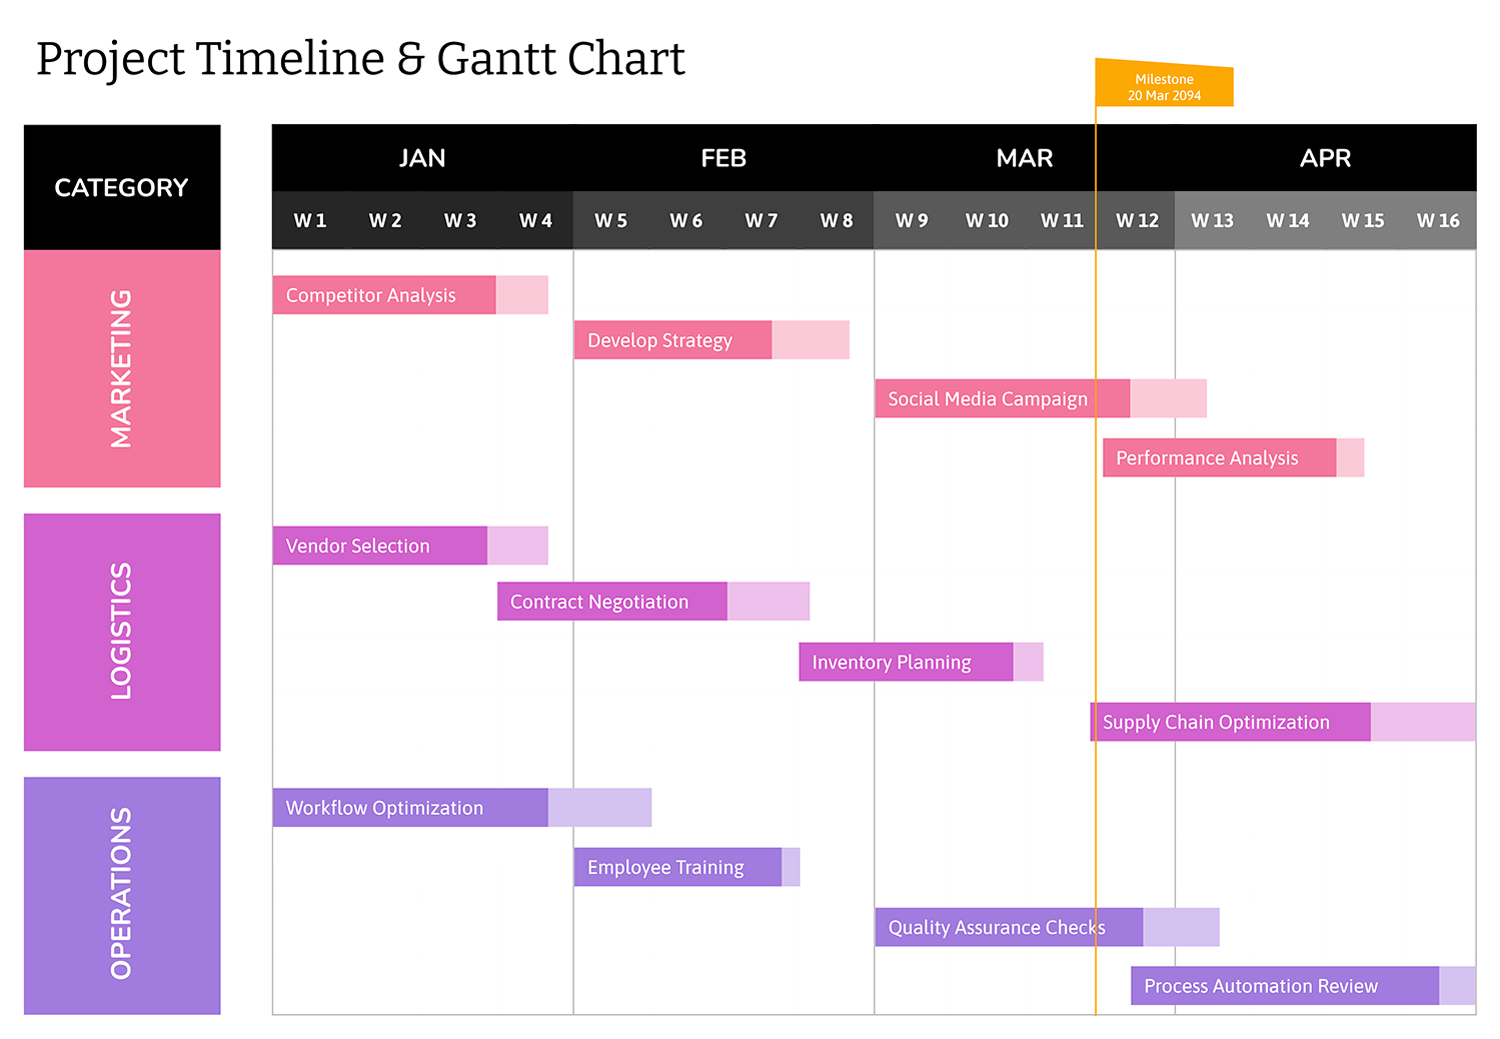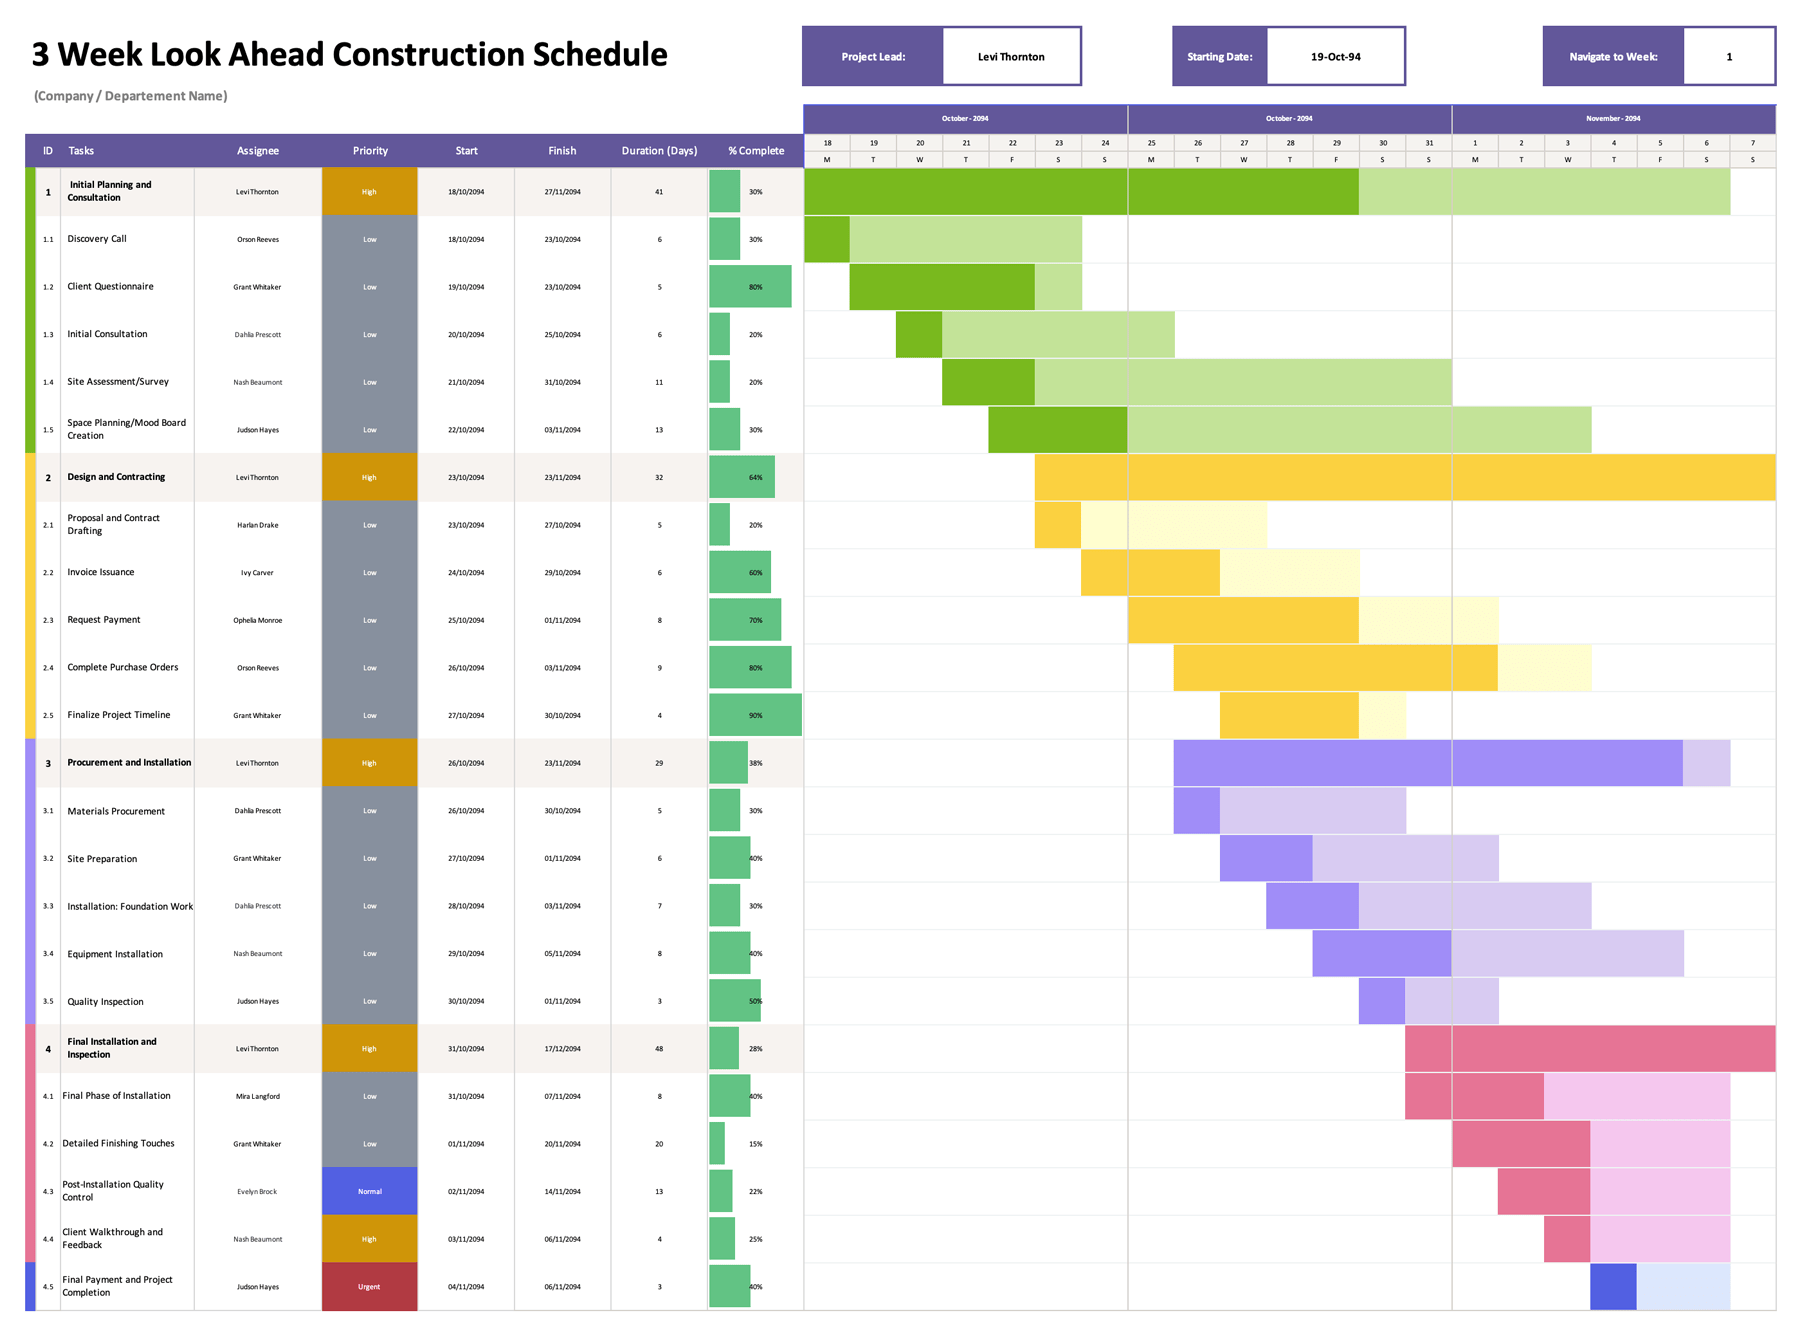


A monthly Gantt chart is used for projects that require close attention to task timing within a defined calendar month. This Gantt chart template supports planning and monitoring work that progresses in short cycles, where start dates, end dates, and daily allocation influence delivery decisions. Tasks are aligned with actual calendar days, making it easier to review how work is distributed across the month and where schedule pressure may build.
The Gantt chart centers on date based scheduling rather than abstract phases. Each task is connected to specific days, which assists with reviewing sequencing, confirming responsibility, and assessing whether progress aligns with the planned timeline. This makes the template suitable for operational planning, delivery focused projects, and short duration initiatives that require frequent review.
Using The Monthly Gantt Chart Template
Start by setting the month and calendar range, then enter tasks in the order you plan to deliver them. After that, you can refine ownership, progress, and status as the month moves forward.
Enter Project Details
Fill in the project name and project manager at the top. This keeps the file identifiable when it is saved with other project documents or shared with stakeholders.
Set the Monthly Calendar Dates
The header row contains the daily dates for the month. Update those date cells so they match the month you are planning. Once the calendar dates match your month, every task bar is evaluated against those dates.
This template displays 28 daily columns by default. For months with 29, 30, or 31 days, add the extra date columns to the right, then extend the same formatting and conditional formatting range so the added days behave like the existing ones.
Add Tasks and Ownership
Enter each task name and assign an owner in the Assignee column. Many teams use initials, role labels, or vendor short names to keep the grid readable. If you want more detail, expand a large deliverable into smaller tasks that reflect handoffs, approvals, or inspection checkpoints.
Enter Start and End Dates
Add a start date and end date for each task. In Excel and Google Sheets, the chart shading is driven by those dates. The Total Days cell uses a formula that counts the duration as an inclusive range, which matches how schedules are often discussed on real projects.
If you track workdays rather than calendar days, keep using real calendar dates for visibility, then interpret Total Days as elapsed days. For tighter workday planning, some teams add a notes column to record expected working days separately.
Use the Percent Column for Progress Checks
The percent column is intended for quick progress reporting during the month. It does not control the shaded bar in the timeline section. Treat it as a reporting field that can be updated during reviews, standups, or status calls.
Update Status for Reporting and Filtering
Use the Status column to label each task with a state that matches your workflow. The default labels are formatted visually, so a schedule review can focus on what is delayed or blocked without reading every row.
Customization
If tasks extend beyond the month, you can either split the work into two rows, one for the portion in the current month and one for the portion in the next month, or duplicate the template for the next month and carry the task forward with updated dates. This keeps each monthly file easy to review while still reflecting longer work items.
File Format and Editing
Excel and Google Sheets are intended for automated timeline shading and duration calculations. PowerPoint and Google Slides are intended for manual editing when you want a presentation friendly schedule for meetings, reports, or client updates.
FAQs
Update the calendar date header cells so they match the month you want to plan. After that, adjust task start and end dates so they fall within the new calendar range. The timeline shading responds to the updated dates in Excel and Google Sheets.
This usually happens when the task dates fall outside the calendar dates shown in the header, or when a start date is later than the end date. It can also happen if a date was typed as text rather than entered as a real date value. Correcting the date entry normally resolves it.
Use percent as a progress reporting field during check ins. It is useful for sharing progress without changing planned dates. If you want the chart to visually reflect percent complete, that would require a different formatting logic than this template uses.
Monthly Gantt chart template for tracking task timing across daily dates. Add owners, start and end dates, progress percentages, and status labels, then update the month as plans change.